To zoom in place two fingers on screen and move them apart. To zoom out pinch fingers together.

Today’s Prices
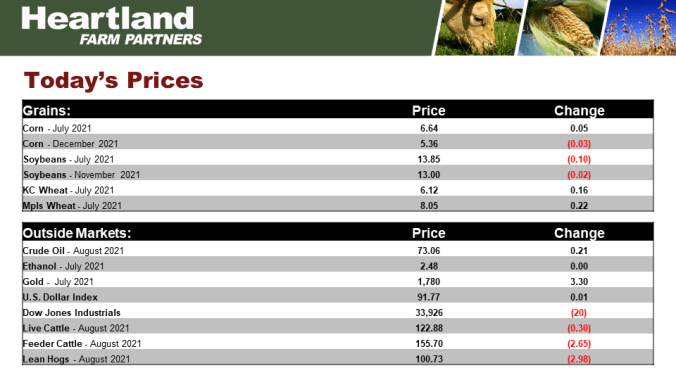
Grain prices were mixed today with new crop prices mostly lower due to good rain in the forecast.
Grain Market News

CRP Enrollment

The Planted Acreage report will be affected by a number of items. One would be CRP which is Conservation Reserve Program acre enrollment. This map shows where the CRP acres are in the U.S. The western Plains has a high concentration of CRP with the northwestern belt also seeing a lot of CRP acres. The most recent data for this year’s growing season shows CRP enrollment at 20.8 mil acres. A little bit over a million less than last year which means 1.18 mil acres would come back into production that was in CRP last year. The reduced CRP enrollment would be a few more acres, a little of 1 million acres likely planted to corn, beans, or wheat.
CRP Acres

This graph looks at a long term chart of CRP acres. This year is at 20.8 mil acres. The 2018 Farm Bill gives us a cap of 25 mil this year, 25.5 mil next year, and 27 mil 2 years from now. In fact, the Biden Administration is working hard on trying ways to increase enrollment to the 25 mil acre cap next year. But for this year, just 20.8 mil acres enrolled in the CRP program.
U.S. Prevented Plant Acres

Another item that has a big impact on acreage is Prevented Plant. Two years ago we had an all-time record amount of prevented plant acres, 18.1 mil acres of just corn, beans, and wheat. Last year 8.9 mil acres of prevented plant for corn, beans, and wheat. We believe this year we believe it’ll be minimal. We’ve calculated 2.434 mil acres of prevent plant this year. It might be even a little bit less. What that means, the acres between this year’s prevented plant and last year’s prevented plant which is about 6.5 mil acres, that will come back into production.
Double Crop Bean Acres: % of Total Bean Acres

Another big factor for acres is the number of double crop bean acres. Over the last 5 years the U.S. has planted 4-5% of total bean acres as double crop. The USDA does not identify a specific acreage just a percentage each year. We believe the much higher prices we’re seeing right now is going to increase double crop acres to 8%, maybe 9%. Going from 5% last to 8% this year would add about 3 mil acres to the total soybean cropped area. Is it possible that we could see 9% or 10%? That’s possible but we have to keep in mind, at 8% there are only 2 years higher over the past 25 years. As we look at planted acreage in next week’s report from USDA, we know that double crop bean acres are likely to be up sharply from last year, prevent plant likely to be down sharply from last year, and CRP is down from last year. All of those 3 items will contribute to larger planted acreage this year and we think USDA is likely to increase it’s planted acreage estimate in the June report next week.
Weekly Ethanol Production

Weekly ethanol production did increase to 1.048 mil barrels/day. That’s above the level needed to reach USDA’s export forecast and the second highest of this marketing year.
Weekly Stocks of Fuel Ethanol

Weekly stocks of fuel ethanol also increased to 21.117 mil barrels. That’s very close to our level from a year ago and although we’ve increased 4 weeks in a row, we’re still just at an average level of stocks versus the last 6 years. We’re certainly not at a surplus level.
Grain Market News

30-Day Rainfall % of Normal

Including the rain that has fallen recently, the 30-day rainfall as a % of normal shows a large area that has less than half of the % of normal rain over the last 30 days. And those are the areas that are in most need of rain with the rain event coming up tomorrow through Saturday. We’re not as concerned in the eastern belt where their rainfall has been closer to average or even above average over the last 30 days.
7-Day Precipitation Forecast

This map shows soaking rains in the next 7 days and most of this over the next 3-4 days. 1-3” of rain with some areas getting 3-5” of rain is forecasted from now through Sunday. Rainfall is lighter as you move to the north and west. The good news is that southern MN could pick up 1” of rain and south SD and NE could also pick up an inch of rain as well. So there is some pretty good rain in the forecast, if this forecast verifies.
6-10 and 8-14 Day Forecast

If the rain doesn’t materialize the 6-10 and 8-14 day forecasts does show some threatening conditions for the far northern and northwestern belt where temperatures could be above normal as we approach for first half of July and precipitation looks like it will be below normal in the northwestern belt. So the rains that are expected over the next 3-4 days are going to be very important for crop potential.
July Corn Chart

Corn prices remain in a pennant formation and anything within this range is fair game as we head into the USDA’s Stocks and Acreage reports. Nearby July corn has rallied a little bit over the past few days and that was enough to turn the technicals. While new crop corn has not rallied and the chart looks much more disappointing. We’ll take a look at new crop corn charts in the next few days to come.
July Soybean Chart
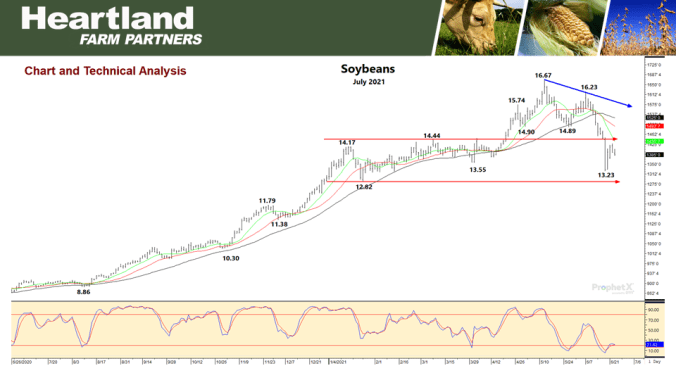
Soybean prices have bounced off the lows last Thursday but over the last couple of days they’ve inched a little bit lower. That keeps the technical indicators somewhat chopping sideways, near the oversold level. Beans have overhead resistance around $14.44. Initial support is at $13.23 and today we’re trading at $13.85, fairly close to overhead resistance and nearby chart support.
July KC Wheat Chart

Wheat looks similar to corn in that we’ve been in a pennant formation but wheat is trying to break out to the upside and that’s based on potential crop losses in the spring wheat areas of the northern Plains and also white wheat losses in WA, OR, and ID. At least the last couple of days, wheat has been clearly the upside leader on potential crop losses.

To return to the previous page on your mobile device, click the back arrow in the bottom tool bar.