Closing Market Comments June 21, 2023

Today’s Prices

Grain markets finished sharply higher today as there is still no major change in the weather forecast and crop conditions fell more than what was expected.

Grain Market News

Calculated Soil Moisture

The lack of rainfall has allowed soil moisture compared to normal to be below average in almost the entire belt.

Topsoil Moisture

Corn and Soybean Topsoil Moisture

Corn Crop Conditions

Soybean Crop Conditions

Grain Market News

7-Day Observed Precipitation

Weather will continue to be the primary driver for grain prices.

We have a large area that has received very little rain over the last 7 days.

There was some rain in Iowa, southern Minnesota, northern Missouri but those rains were scattered.

High Temperatures

In addition to the lack of rainfall, dry soil is allowing temperatures to rise into the 90s in some of those driest areas.

Upper 90s in the North Dakota and northern South Dakota and then in and around 90 throughout almost the rest of the belt.
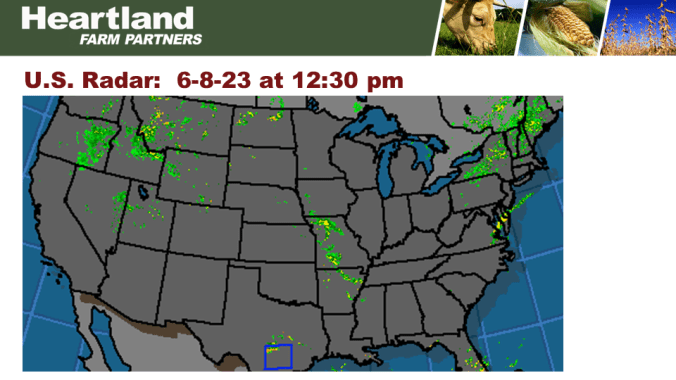
U.S. Radar

Today’s radar shows some rain out in the plains, also some rain to the southeast and east coast.

Unfortunately, the heart and the bulk of the belt are dry.

7-Day Precipitation Forecast

The forecast shows very good rain in western Nebraska, the Dakotas, and much of Minnesota.

Very good rains in the southeast and east coast of the U.S.

Unfortunately, there is less rain with less than a half an inch across the heart of the belt.

Outlook

Our 6–10-day temperatures as well as the 8-14 day showing mostly above normal temperatures.

 A high-pressure ridge in Texas is expected to build up towards the southwestern belt and could be somewhat similar in the 8-14 day.

Ridge riding rains are possible across the Dakotas, Minnesota, Wisconsin, and Michigan in the longer term map but unfortunately these types of rainfall have not developed over the past few weeks.

May Corn Chart

Corn prices have exploded to the upside with today’s high at 6.29, a new high.

We are getting close to the highs from September-November timeframe.

In fact, the high prices were posted in October at 6.37.

If we got negative news the market could easily set back into the range.

The upper end around 5.98 would be a target if we see improved weather.

If it doesn’t improve then corn will likely push into new highs.

May Soybean Chart

Soybean pushed into new highs at 13.78.

We have multiple highs around the 14-14.25 levels which is the target if we continue to get friendly weather or hotter weather.

If we start to see an improved forecast this market could easily fall back into the 13.38-12.85 area.

May KC Wheat Chart

Wheat rallied to a new high for this move up to 8.76.

That’s up about a dollar in just a week’s timeframe.

Wheat is primarily a follower of corn and beans.

We are going to see if what can continue to work towards that $9 level.

Questions or Comments

Closing Market Comments June 20, 2023

Today’s Prices

Grain markets finished mixed today as grain prices are pausing for a moment following the big rally over the last few weeks to determine if weather Is going to continue to stretch crops or if it will improve.

Grain Market News

7-Day Observed Precipitation

Over the past 7 days there has been some good rain.

Areas like Ohio and portions of eastern Indiana have received good rain.

There has been a pocket of good rain in central Iowa and then the Delta did receive some rain as well as the plain states.

A good portion of Illinois and southern Indiana has completely missed out and the eastern Dakotas as well as other isolated areas.

30-Day Precipitation

We still see an area where rain has been short of normal.

Less than 25% of normal and some less than 10% less of normal.

High Temperatures

In addition to lack of moisture, yesterday we seen temperatures start to ramp up in the plains.

South Dakota saw plenty of 100s with 90s scattered across most of the plains and 90s scattered within portions of the heart of the belt.

These temperatures are not extreme in the heart of the belt around 90 but certainly going to be stressful if you are in a dry pocket.

U.S. Radar

Today’s radar shows virtually no rain across the belt.

The only area is scattered showers in portions of Ohio.

7-Day Precipitation Forecast

There is a very good rain forecast in central, western Nebraska into North and South Dakota and northwest Minnesota.

Much of that would be welcome.

Unfortunately, we have less than a half of an inch expected across much of the heart of the belt.

Soil Moisture Change

This shows that the area where soil moisture will likely decline over the next week in the heart of the belt while we see improvement to the north and east.

The heart of the belt will continue to see soil moisture decline based on today’s forecast.

Soil Moisture Anomaly Change

This shows a continuation of that same pattern with soil moisture declining across the heart of the belt and improvement to the north and east

Outlook

Our 6-10 day calls for above normal temperatures as well as the 8-14 day which isn’t the best news for this time of year.

Precipitation does not look overly threatening but this projection for normal rainfall in the heart of the belt has not been able to verify.

Vegetation Health

The weather determines our crop yields and ultimately production in the supply and demand balance sheet.

As weather affects crops, we can sometimes get an indication from the vegetation health index.

The Vegetation index from last week shows that much of the belt saw the conditions decline

Vegetation Health Change

We see serious deficits compared to a year ago for most of the belt.

Grain Market News

May Corn Chart

Corn prices pushed to a new high early last night and then pulled back going lower and then closed unchanged on the day.

The chart looks good with the new high, but prices closed unchanged.

How high the market goes is determined by the weather.

May Soybean Chart

Soybean prices consolidated in late May as the weather turned dryer.

Then the market rallied in early June and then last week as crop conditions were falling the market rallied sharply.

This is a weather market; everything depends on the weather.

May KC Wheat Chart

Wheat prices consolidated today; it was an inside trading day.

If corn and beans continue to rally, wheat could easily start to move towards the $9 level.

Looking at the wheat chart alone, it does look good.

Questions or Comments

Closing Market Comments June 15, 2023

Today’s Prices

Grain markets finished sharply higher today, it’s not only our conditions being dry but there is not much rain in the forecast causing additional concerns.

Grain Market News

Topsoil Moisture

U.S. Topsoil Moisture

U.S. Corn and Soybean Topsoil Moisture

U.S. Drought Monitor

Virtually the entire U.S. corn and bean belt is in some type of drought except for portions of North Dakota, southwest Minnesota, and a portion of northeast Kansas.

4-Week Change in Drought Monitor

Anything in yellow or tan is where drought has worsened and anything in green or blue is improving.

Drought has certainly improved in the central and western plains but across the majority of the belt drought conditions have gotten worse.

7-Day Observed Precipitation

Over the last 7 days we got rain in portions of Indiana and much of Ohio which is an area that is benefiting from the rains.

From southern Minnesota into Iowa and northern Illinois we have gotten little to no rain.

This area is getting extremely dry with crops under stress.

30-Day Precipitation % of Normal

We have a lack of rainfall in the key areas of the U.S. corn and bean belt.

High Temperatures

The dry soil is allowing the temperatures to really warm up in the afternoon.

Yesterday we had temperatures into the low 90s in portions of western Illinois and eater Iowa.

U.S. Radar

This shows high and dry across the belt.

We are hoping some showers can work into the western belt into the weekend.

7-Day Precipitation Forecast

The forecast shows rain through the central and northern plains and also in the southern belt down into the delta and southeast.

Unfortunately, from portions of Minnesota, Iowa, Illinois, Indiana, and the Great Lakes regions there is very little rain in the forecast for the next week.

Outlook

Temperatures are similar to yesterday with above normal temperatures in the 6-10 and the 8-14 day.

We could maybe get some better precipitation in the 8–14-day forecast.

May Corn Chart

Corn prices exploded to the upside, that likely allowed short covering as well.

As of yesterday, the funds were net short 44 thousand contracts of corn in a market that is accelerating to the upside.

The funds are likely trying to get out of those short positions.

Technical indicators were over bought but the market surged to new highs, breaking out above our downward trend line, matching the high posted in March at 5.75.

The next target would be close to $6.

May Soybean Chart

Soybeans exploded to the upside with the warmer temperatures.

We took out the highs from May at 12.85 leaving something in the $13.25-13.38 level as the next level of overhead resistance.

May KC Wheat Chart

Wheat prices made a move to the upside, closing sharply higher.

We took out the consolidation ranges we have been in for about a week.

The next level of overhead resistance will be at 8.47.

Questions or Comments

Closing Market Comments June 9, 2023

Today’s Prices

Grain markets finished mixed today as USDA June crop report did not provide any surprises.

Weekly Price Summary

Grain Market News

U.S. Ending Stocks

World Ending Stocks

South American 2023 Production

Corn S&D

Soybeans S&D

Wheat S&D

Grain Market News

Corn Areas in Drought

 Minor production areas in light green, major production areas in dark green, and then areas right now that are covered by the U.S. drought monitor are in the red areas.

USDA is currently estimating that approximately that 45% of U.S. corn acres are seeing some kind of drought conditions.

This compares to just 34% one week ago and just 26% two weeks ago.

7-Day Observed Precipitation

We see very dry conditions in the eastern corn belt, mixed precipitation with some areas good rain and some completely missed in the central belt, and then very good general rain in the western plains.

Corp conditions will almost certainly decline in the eastern belt and somewhat mixed in the western belt in Mondays update.

We believe crop conditions could drop 2-3 maybe 3-4 percentage points next week.

U.S. Radar

The eastern belt has not gotten much rain this week and there is no rain on the radar today.

They are going to have to wait until Sunday when we will start to see better moisture and opportunities for rain.

7-Day Precipitation Forecast

The forecast is still calling for some decent rain from .75-1.25 inches across much of the central belt, heavier rains to the south, much lighter rain to the north.

If this forecast verifies it will still leave areas short of moisture.

May Corn Chart

Corn prices did slip lower early in the day but turned around closing closer to unchanged and a dime off the daily low.

We got mixed signals for today and for the week.

We do see some topping action in the short-term chart and the short term technical.

From a longer-term perspective we did break out above the 40-day moving average.

The chart overall is mixed with overhead resistance at 5.48 and chart support at 5.20.

Today we closed at 5.34.

May Soybean Chart

Soybean prices had a good day with a new high for the move and a new high close above $12.

The chart for beans looks good as well as the technical indicators.

Overhead resistance is in the 12.40-12.50 range.

May KC Wheat Chart

Wheat did not provide any strong signals today with an inside trading day.

This leaves the market chopping back and forth within the same range going back to November.

Questions or Comments

Closing Market Comments June 8, 2023

Today’s Prices

Grain markets finished higher today with current conditions still somewhat threatening and a crop report coming out tomorrow from USDA.

Grain Market News

High Temperatures

The past weather and current weather are supportive of bullish news, but the forecast is certainly not hinting at additional problems but improvement down the road.

Yesterday’s high temperatures do show some cooler temperatures with mid-70s to lower 80s in the eastern belt but still some heat with 90s in the far western belt into he eastern plains.

Surface Dew Point

This dew point map as of noon today shows extremely dry air in the eastern belt.

Dew points in the middle of June in the 30s and 40s are extremely rare, especially in the eastern belt.

Even though temperatures are only in the mid/upper 70s and lower 80s, evaporation and soil moisture loss are rapid due to the extremely dry air.

7-Day Observed Precipitation

Unfortunately, the eastern belt down into the delta for the most part has missed out on rains over the last week.

Corp conditions likely deteriorating in the eastern belt.

30-Day Precipitation % of Normal

Over the past 30 days this map shows precipitation shown as a percent of normal and you can see almost the entire U.S. corn and bean belt has been below normal.

The exception would be pockets in southwest Minnesota into northwest Iowa.

From eastern Iowa into the eastern belt there are many locations that are red, which means less than 25% of normal.

Drought Monitor Change

That lack of precipitation is also allowing our drought monitor to show an increase in drought in the eastern belt.

This is the drought monitor change over the last 4 weeks.

Anything yellow or tan is where it has gotten worse and anything in green or blue is where it has improved.

Drought has increased 1-2 categories in almost the entire central and eastern belt while drought has improved significantly in areas of the western plains.

U.S. Radar

The current radar shows rainfall along that boundary where we have cooler, dryer air to the east and moist air in the western belt.

Along that boundary is where we see some showers and thunderstorms.

7-Day Precipitation Forecast

Anywhere from half to an inch and a quarter is expected in the eastern belt with 1-3 inches of rain possible in the southern Ohio valley down into the delta.

The area that may miss out would be the northern and northwestern belt where generally less than half an inch or less than quarter of an inch is expected.

Outlook

The forecast is nonthreatening as we look further out.

The 6-10 day shows temperatures close to normal with a little warmer in the 8-14 day.

Precipitation is about average in the central and heart of the belt in the 6-10 day and about normal in the 8-14 day.

Grain Market News

U.S. Ending Stocks

May Corn Chart

Corn prices have had a couple of disappointing days.

We posted highs earlier in the week at 5.48 but last night we were down to 5.20.

The good news today is we were able to reverse and close higher at 5.33.

Not only did we close near the daily high but 13 cents off the daily low.

Overhead resistance at 5.48 and chart support at 5.20.

May Soybean Chart

Soybeans have also been carving out a range recently with 11.95, the high earlier this week and today’s low at 11.68.

Today’s close within that range.

We currently have overhead resistance close to $12 with chart support around $11.65.

May KC Wheat Chart

Wheat prices have been extremely volatile, today was no exception.

We made a new low for this move down to 7.82 overnight last night but turned around closing at 8.04.  

This puts overhead resistance at 8.47 and chart support at 7.82.

Questions or Comments

Closing Market Comments June 7, 2023

Today’s Prices

Grain markets finished mostly lower today as the weather forecast is showing improving chances for rain this weekend and next week.

Grain Market News

U.S. Yield and Production 2023

U.S. Ending Stocks

South American 2023 Production

World Ending Stocks

Weekly Ethanol Production

Ethanol production surged to 1.036 million barrels per day last week, that’s the highest level we have seen back to the middle of December.

Production is getting close to the level needed to reach the current USDA projection.

Year to date is running behind USDA’s target, we are down 2.7% and the USDA projection is 1.5%.

Weekly Stocks of Fuel Ethanol

We saw an increase in ethanol stocks for a second week in a row up to 22.9 million barrels.

That is still 2.9% below the year-ago level.

Gasoline use over the past week was about equal to a year ago.

4 of the last 5 weeks have shown U.S. gasoline consumption above the year ago level which is good news.

Grain Market News

High Temperatures

The current weather is still stressful.

Yesterday’s high temperatures were in the mid-80s to low 90 across almost the entire belt.

The exception would be in the lower Great Lake states where some upper 70s and low 80s were reported.

U.S. Radar

This shows there is a front from Minnesota through Iowa and down through the southern portion of the eastern belt.

Cooler, dryer air is being seen in the far eastern belt but along this frontal boundary we are seeing a few showers.

7-Day Precipitation Forecast

The forecast shows that frontal boundary draped across the southern and eastern belts over the next week.

That would allow for anywhere from .75-1.25 inches in most of the eastern belt and 1-2 inches in the southwestern areas.

While lesser totals are expected in the far north.

Outlook

The forecast looks mostly non-threatening.

Temperatures at or around average across most of the belt in the 6-10 day and then a little bit warmer in the 8-14 day.

Precipitation is near normal in the heart of the belt, little more to the south and the 8–14-day forecast is normal to slightly above normal.

May Corn Chart

Corn prices had an outside day down meaning we took out yesterday’s low.

We did have a clear breakout above the 40-day moving average.

The short term does look somewhat toppy and the technical indicators are hooking downwards.  

Weather is the primary driver, the weather forecast improved, which was enough to turn our chart downward.

May Soybean Chart

Soybean prices consolidated with an inside trading day.

Overall, the chart still looks pretty good as long as we can hold this chart support and technical indicators are still pointed upward.

May KC Wheat Chart

Wheat has been the most volatile of the grains.

Within the last 2 weeks sharp down, sharp up and so on.

Not only over the last 2 weeks but over the last 5-6 months.

Chart support is down in the 7.63 range with overhead resistance around 8.85.

Recommendations

Questions or Comments

Closing Market Comments June 6, 2023

Today’s Prices

Corn and soybeans finished higher today as crop conditions declined more than expected, but there is rain in the forecast which kept prices under control.

Grain Market News

14-Day Observed Precipitation

The eastern corn belt down to the delta has received very little to no rain over the last 2 weeks.

We have seen scattered rain in the western corn belt with general rain in the plains.

Topsoil Moisture

Just 3 weeks ago there were really no issues in the eastern corn belt and very quickly we have gone to 72% short in Illinois, 688% short in Indiana, and in the 70s for Ohio, Pennsylvania, and Michigan.

The central belt like Minnesota has gone from 7% to 34%, Iowa 55% short, and Missouri 75% short.

Oklahoma and Colorado are now in pretty good shape.

U.S. Topsoil Moisture

That 57.7 is rounded to 58% which is the driest for any week during our growing season going back to 2013.

Corn and Soybean Topsoil Moisture

We are now the driest we have been in over almost 20 years at this time of year.

U.S. Corn Crop Condition

The combination of dry soil and hot temperatures over the last week allowed the corn crop conditions to drop by 5% to 64%.

U.S. Soybean Crop Condition

The initial rating came in at 62%, last year’s rating was 70%.

So, we are coming in below average for the soybean conditions.

7-Day Precipitation Forecast

Markets are being cautious because the forecast is adding rain.

In fact, .75-1 inch is now forecast over the next week in the eastern belt as well as the southern belt.

The northern belt is only expecting scattered rains.

Outlook

The 6-10 and 8-14 day has temperatures close to normal in the heart of the belt with a little warmer to the north and cooler to the south.

But then heat starts to come in in the 3rd week of June.

Precipitation still shows dryer conditions to the north, wetter to the south, with near normal across the heart of the belt in the 6-10 day.

The 8-14-day show near normal conditions for most of the belt and wetter conditions out in the north and west.

Soil Moisture

If the forecast verifies the weather service is projecting improvement in the moisture.

If the weather service is correct the soil moisture would improve, which is keeping markets in check.

Dam Breach

Kakovka Dam

May Corn Chart

Corn was unable to make new highs today, so yesterday’s high of 5.48 is intact.

We did close higher for the day though which left the chart pointed upward.

Technical indicators are overbought.

May Soybean Chart

Soybean prices did not make a new high today but did close a bit higher, so the chart is pointed upward.

The technical indicators are pointed upward.

We are in an area of consolidation and have been unable to breakout above that.

The next area of overhead resistance would be near 12.50.

May KC Wheat Chart

Wheat prices exploded to the upside overnight last night posting a high of 8.47.

We did close nearly unchanged on the day though.

Wheat has very quickly rallied towards the middle of its sideways trading range.

Chart support is down at 7.63 with overhead resistance just shy of the $9 level.

Questions or Comments

Closing Market Comments June 5, 2023

Today’s Prices

Grain markets finished mixed with corn and soybean finishing lower as midday weather maps added rain to the forecast for this weekend.

Grain Market News

7-Day Observed Precipitation

Back to last week, there has been very little to no rain in the delta and into the eastern belt, just a few scattered showers.

In the central and western belt there has been some scattered precipitation, areas of Iowa have seen nice showers as well as Minnesota, Kansas, Nebraska, and Oklahoma.

Unfortunately, much of the heart has not seen the soaking rain.

High Temperatures Friday

Friday temperatures for the entire belt were in the upper 80s to low 90s.

High Temperatures Saturday

Saturday had upper 80s and low and mid 90s across the entire belt.

High Temperatures Sunday

Yesterday’s temperatures were mid to upper 80s and low to mid 90s.

These temperatures have been above normal and around the 90-degree mark for about a week now.

U.S. Radar

Current conditions have some very dry air moving in from Canada impacting the eastern belt.

Not only are temperatures warm but dew points are low.

Scattered rainstorms could pop up in the central and western belt today.

7-Day Precipitation Forecast

This did add some rain into the southern belt where maybe a half inch to .75 totals could be seen.

This is still below average, but it is an improvement which allowed the market to reverse from trading higher this morning to trading lower at today’s close.

Outlook

The heart of the belt looks normal to slightly below normal temperatures in the 6-10 days and normal or slightly below normal in the 8-14 day.

Precipitation shows a dry trend for the northern belt through the 14-day forecast but improved or wetter conditions are possible in the southern belt down into the delta.

Soil Moisture

That improved forecast can be seen when looking at soil moisture.

You can see there are a few areas where soil moisture could improve.

Grain Market News

Corn: Weekly Export Inspections

Corn exports came in at 46.49 million bushels, down a little bit from the last couple of weeks.

Over the last 4 weeks exports have been running close to the target.

Year to date after ¾ of the marketing year is behind us, corn exports are down 31.7% and USDA is projecting 28.2%.

Soybeans: Weekly Export Inspections

Soybean exports have been somewhat disappointing over the past 4 weeks running a little bit behind the pace needed to reach the current export forecast.

The good news is the year-to-date exports, after 3/4 of the marketing year is behind us, are down 2.5%, which is above the target of 6.6%.

May Corn Chart

Corn prices did make a new high for the move up to 5.48.

That has allowed corn prices to attack that level between 5.47-5.37.

This doesn’t mean the corn market can’t go higher, it just tells us from the chart perspective we need to see some bullish news.

If we don’t get bullish news, current chart support would be around 5.25-5.30 area.

Overhead resistance is around 5.60.

May Soybean Chart

Soybean prices have turned the corner and are pointed upward. 

A new high was established today at 11.95 and the technical is pointed upward.

Overhead resistance in the next area is up in the 12.47 area.

We would need to see some friendly news over the next few weeks to test overhead.

May KC Wheat Chart

Wheat is pointed upward in the short term and the technical is as well.

Wheat closed higher today, and the first objective has now been achieved.

If wheat could get friendly news, then this market could continue to work higher, possibly testing the upper end of the range.

Wheat closed at 8.20 today.

Questions or Comments