To zoom in on a phone, tablet, or touch screen, place two fingers on screen and move them apart. To zoom out pinch fingers together.

Format for Today’s Special Corn Outlook

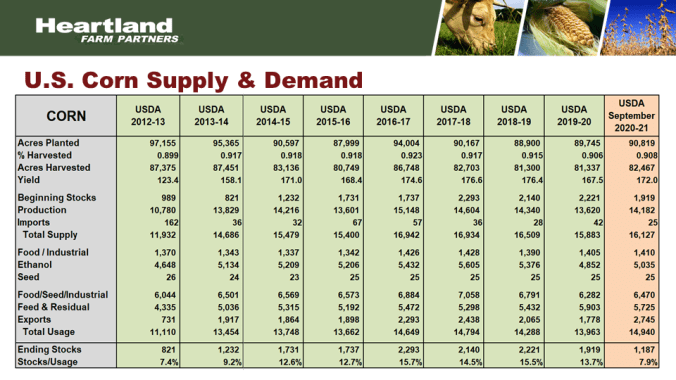
2021-22 U.S. Corn Supply & Demand

U.S. Planted Acreage

Last year we ended up with corn acres at 93.357 mil acres which was an increase from the previous 3 or 4 years. Soybean acres came in at 87.195 mil acres which was a dramatic increase of over 10 mil acres from the past two years while wheat saw the first significant increase in a number of years. Most of this acreage increase was due the acres that were prevented plant the previous years came back into production during 2020 and 2021.
U.S. Planted Acreage Combined

Prevented plant 2 years ago at 19 mil acres and last year at 2 mil. That was 17 mil acres that went back into production and allowed total corn, bean, and wheat acres to go from 211 mil, up to 227 mil acres. An increase of about 16 mil acres over the past 2 years. When we look at that total, 227 mil acres was an acreage that was nearly maxed out. We did have planted acreage around 230 mil acres back in 2011, 12, and 13 but keep in mind that urban sprawl is gobbling up about 0.5 mil acres of prime corn and bean ground every year and as much as 1.5 mil acres when you include all crops including hay. With that in mind we may have a difficult time getting back to 230 mil acres as long as the CRP program remains in place.
U.S. Corn Yield

After we establish our acres we look at yield. Last year’s corn yield came in at 177 bpa. The trendline yield that was being projected early in the year at 179.5 bpa, we came up just a little bit short. Despite the fact that this year’s yield at 177 bpa was a little below the trendline yield was a new record. The previous record 176.6 and 176.4 back in 2017 and 2018.
U.S. Corn Yield

We can see that 177 bpa on a long-term trend chart and it did come in just below trend but next year’s trendline will be coming in a little above 180 bpa.
U.S. Corn Production

When we take our 177 bpa yield times the harvested area which this past year as 85.4 mil acres that gave us a corn crop of 15.115 bb, up a billion from the previous year and up 1.5 billion bushels from 2 year ago.
2020-21 Corn Supply & Demand

Demand for U.S. Corn 2021-22

When we look at where U.S. corn is used, the largest category for corn use is feed and residual. That is 38.1% estimated by USDA this year. A close second would be corn going to the ethanol industry and that is expected to come in at 35.9% total use. A distant third and less than half of what we use for ethanol or feed are exports which come in at 16.3%. Food and other industrial use comes in just a little bit below 10% and very minimal amount goes to seed.
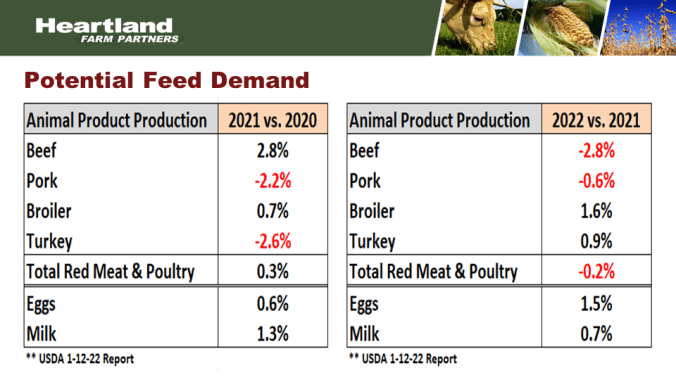
Potential Feed Demand
Weekly U.S. Ethanol Production

The second largest category of U.S. demand is corn use for ethanol. When Covid-19 first impacted the U.S. in the spring of 2020 ethanol production was cut nearly in half. Then in early 2021 we had a huge spike downward based on that massive freeze that took place all the way down to the U.S. Gulf. But recently ethanol production has been extremely strong, near record levels of all-time and its expected ethanol production will remain strong through most of this year. The USDA is projecting the corn use for ethanol will be up 5.9% this year but year to date ethanol production is running up 8.6%. We believe USDA is likely too low by about 75mb. That could take USDA’s estimate from 5.325 bb up to 5.4 bb in crop reports coming out throughout the year.
U.S. Corn Exports

Corn exports hit a record level at 2.753 bb. USDA is projecting exports at 2.425 bb. That is down over 300 mb from last year but still a relatively large level. Due to crop losses in South America this export number may need to be raised by USDA as we move deeper into the late spring and summertime months.
Total U.S. Corn Use

USDA is projecting total corn use at 14.835 bb. That would be an all-time record large beating last year’s 14.82 bb. And keep in mind this number may grow to be something at 15 or even slightly above 15 bb based on South American crop losses.
U.S. Corn Supply & Demand

U.S. Corn Ending Stocks

U.S. ending stocks at 1.540 bb is up from last year’s projected ending stocks but will still be relatively small when we compare the last 20 years. We also want to keep in mind that we believe that ending stocks will likely end up somewhere between 1.3-1.4 bb so something a little bit lower on the chart and could be approaching the levels we saw last year.
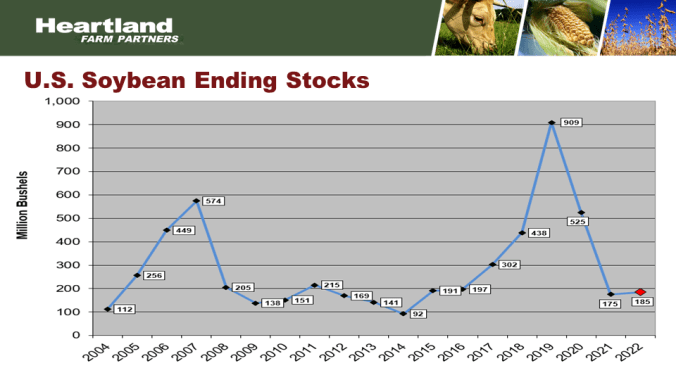
U.S. Soybean Ending Stocks

Soybean ending stocks are also going to be key as the market looks at all the grains combined. Soybean stocks also looking at an increase this year up to 350 mb but still well below the years 2018, 2019, and 2020.
U.S. Wheat Ending Stocks

Wheat ending stocks are expected to decline for the 5th consecutive year, going down to 628 mb. That is near the lowest level over the last 14 years.
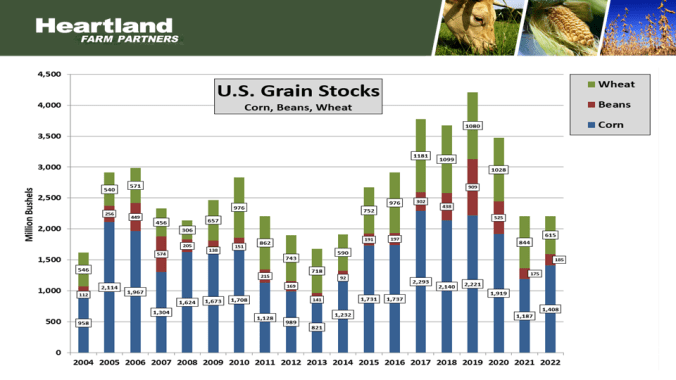
U.S. Grain Stocks

When we combine the major grain stocks of corn, beans, and wheat we can see that USDA is projecting stocks this year will be up a little but still down fairly significantly from the surplus times we saw from 2015-2020.
2022-23 Corn Outlook
U.S. Prevent Plant Acres: C,B,W Combined

Last year we had a very low prevented plant total, just 1.2 mil acres of corn, beans, and wheat. Now total prevent plant was a little over 2 mil but the corn, beans, and wheat total was 1.272 mil acres. That was near historical low, and it is virtually impossible to have prevented plant less than that. Right now we’re projecting a minimal prevent plant at 2.272 mil acres. That is still up 1 million acres from last year that will reduce the number of acres that are available to plant towards crops.
CRP Enrollment

Last year CRP came in at 20.8 mil acres. That has been declining for about 14 consecutive years, but the Biden administration is providing incentives to add acres back into the CRP program. There’s about 3 to 4 mil acres to add from without exceeding the current acreage cap. The current acres enrolled in CRP as of Dec was 22.1 mil acres which means 1.3 mil additional acres have been enrolled in the CRP program that will not be available for crop acres this spring. We’d also like to keep in mind that in a year and half from now the, the 2018 Farm Bill has a max cap at 27 mil acres. And again, the Biden administration is trying to provide incentives to increase acres into CRP.
Price Comparison

Acreage Battle

Market News

South American Weather and Crops

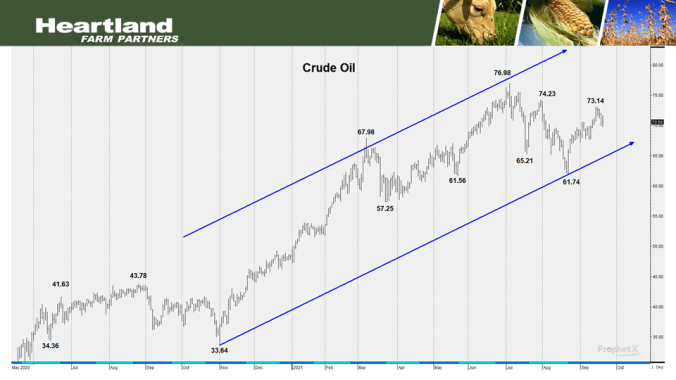
Crude Oil

You can see a consistent uptrend that has been in place for two years now with current prices around $83-$84 per barrel. That compares to low $50/barrel a year ago.
U.S. Drought Monitor

The most recent drought monitor shows expanding and intensifies drought in the U.S. and central Plains while drought has improved in the northwestern corn belt and eastern portions of the northern Plains.
U.S. Drought Monitor Class Change

Over the past month we can see drought is expanding in the central and southern Plains while improving in the northern Plains.
Drougth Monitor Comparison

When we compare our current U.S. drought monitor to last year at the beginning of the planting season on May 4th. The biggest difference is the increase in the drought in the southern and central Plains while we’ve seen a reduction in the drought that was in ND. It is also worth noting that the bulk of the U.S. corn and bean belt, in fact the heart, is not experiencing any serious drought at this time.
Nino 3.4 Temperatures

The drought conditions in the southern Plains is likely due to a La Nina. This chart shows the sea surface temperatures in the equatorial Pacific. Zero is temperatures near normal. Anything above zero is warmer than normal and considered El Nino. Anything below average is considered La Nina. We’re currently under a mild La Nina, about 1 degree below normal Celsius. But one of things that trade is monitoring is that La Nina is expected to continue all the way through October. That could cause a continuation of the current weather conditions which is dry in the western belt and in the Plains states. That’s something the market will monitor as we head towards the springtime.
Corn Monthly Chart

Back in 2014-2020 was a period of surplus supplies of U.S. corn and resulted in corn prices from about $3-$4.40. But then we got into a tight, even rationing situation last year. We took prices into the $5.50-$7.50 range which is similar to prices that we saw in the years of shortage from 2010-2013. After a harvest low around $5 we’ve rebounded prices back into the low $6 range. But we’re still well below the highs posted in April, May, June, and July last year due to the fact stocks, at least at this time, are projected to be a little bit higher than last year. We believe relatively tight stocks is going to provide chart support around the $5.50 level. Anything from upper $5 to mid-$6 is fair game in the near term. Whether or not we can rally into the $7 to $7.50 range will depend on our U.S. stocks situation. If current stocks don’t change a lot from USDA’s projections, $6.00-$6.50 may provide a top. But if demand is strong and we start to project lower stocks, then the market may have to rally to ration prices. The bottom line is that we believe $5.50 current support for corn prices and upper $5 to mid $6 range is probably fair value going forward especially under an acreage battle this spring. Any problems with spring planting or acres or tighter stocks could result in higher prices if rationing is needed.

To return to the previous page on your mobile device, click the back arrow in the bottom tool bar.