To zoom in on a phone, tablet, or touch screen, place two fingers on screen and move them apart. To zoom out pinch fingers together.

Today’s Prices

Grain markets finished mixed today as prices try to stabilize following the collapse earlier this week following the landfall of hurricane Ida in the New Orleans area.
Weekly Price Summary

Grain Market News

Crude Oil

Recent crude oil prices have bounced nicely off the lows posted a week and a half ago and crude oil up nearly $9/barrel from where it was trading in the 3rd week of August. After finding major chart support between $61-$62, the market has very quickly moved up to initial overhead resistance where we have an intermediate downtrend coming into play. If that could be broken it would certainly open up the door for a move between $74-$76/barrel. The first step would be for crude oil to break through overhead resistance.
U.S. Dollar Index

The U.S. dollar index has fallen after rising fairly consistently through most of the summer. The U.S. dollars had had a fairly significant pullback from 93.75 down to 91.80. That is nearly a 2% drop in the value of the dollar and that is significant when it comes to U.S. exports. Not only has the market fallen approximately 2% but we’ve broken through chart support. Overall, a lower dollar means more competitive prices for U.S. exports, so a lower dollar is good news for the grain markets.
DOW Jones Industrial Average

Despite covid making another surge, despite the huge wildfires in the west and mountain region, and despite hurricane Ida which ravaged areas in the New Orleans region, the stock market remains near all-time highs and remains in an uptrend that’s been in place since March a year and a half ago at the peak of the pandemic. Bottom line, in the outside markets is that they’ve turned more supportive for the grains.
Grain Market News

High Temperatures
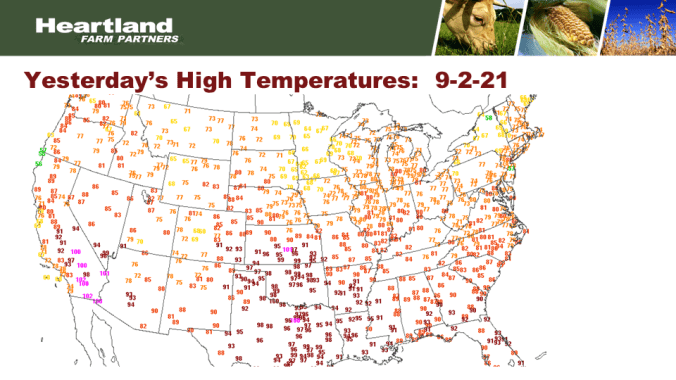
Weather doesn’t look to be threatening factor at all right now. Temperatures yesterday in the heart of the belt mostly in the 70’s and a few low 80’s with some 60’s in the far northern where rain and cloud cover was present. There was some heat in the southern Plains but that is not the heart of the belt and crops in the deep south are close to harvest or beginning harvest already.
7-Day Observed Precipitation

Another round of soaking rain this week in the northwestern belt along with rains in the OH Valley and yet there wasn’t a lot of flooding. We should see crop conditions steady to maybe slightly better next week in USDA’s update following the Labor Day weekend. We will note that there are some areas that have not received rain this week and crop conditions could be lower in those areas. But a large area of soaking rains is likely to allow conditions to be steady or slightly better.
7-Day Precipitation Forecast

The next 7 days shows precipitation wrapping up in the southern belt over the next 48 hours and then drying sets in especially in the northwestern belt and northern Plains. We should see a warm, dry spell as we head deeper into Sept towards the middle of the month.
6-10 and 8-14 Day Forecast

The 6-10 and 8-14 day forecast shows above normal temperatures in the west, normal to slightly below normal in the east in the 6-10 day but everybody looks to be above normal in the 8-14 day. Good news as we approach harvest, the fact that we have adequate soil moisture and crops are pushing towards harvest, below normal precipitation for the first week of September and mixed temperatures for the second week so no significant threat for corn and bean crops in the field. We view the weather forecast at this time as non-threatening as there is no frost in the forecast for the next two weeks. We view that as lightly bearish for grain prices.
December Corn Chart

Corn prices trying to consolidate now a little bit, stabilizing after a sharp break on Mon, Tues, and Wed and the damage caused by hurricane Ida but markets often factor in a worst case scenario as quickly as possible and then as the situation starts to return to normal prices could bounce as well. The first level of significant overheard resistance would be up near our moving averages, close to the $5.45-$5.50 area. That would 20-25 cents above where we closed today. Technical indicators are oversold and our position to turn higher if we could get a day or two of higher closes.
November Soybean Chart

Soybean prices very similar to corn except soybeans have had a little bit better bounce over the past couple of days and it’s enough to turn our technical indicators up from the oversold area. Chart and technicals would tell us soybeans are likely interested in heading towards overhead resistance, up towards the $13.35 area and that would be about 40 cents above where we closed today. It’s worth noting in corn and beans even if you’re bearish you have to respect the possibility of a bounce towards the upper end of the range. That is not necessary a ceiling. That’s just the first target and from there the market will look to see if there is any additional bullish news to push us higher.
December KC Wheat Chart
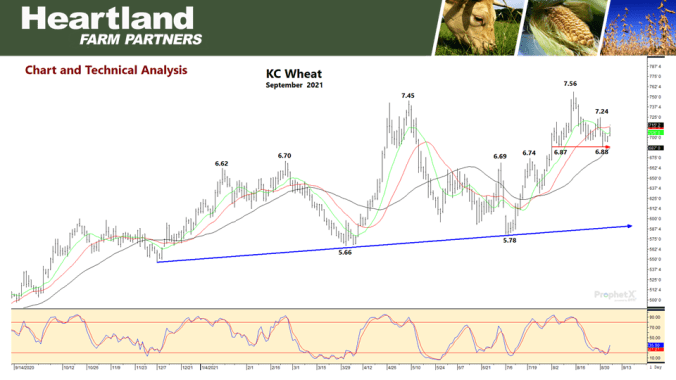
Wheat prices also bouncing off of Wednesday’s low. Enough to turn the technicals so wheat chart and technicals indicate the market is going to test the $7.24 level. But if we can get some friendly news the market could easily push through that $7.24 but that would be the first upside objective headed into next week.

To return to the previous page on your mobile device, click the back arrow in the bottom tool bar.