To zoom in on a phone, tablet, or touch screen, place two fingers on screen and move them apart. To zoom out pinch fingers together.

Today’s Prices

Grain prices finished mixed today. Corn was higher on lower crop condition ratings while wheat was higher on lower Stat’s Canada numbers while beans were a little lower on the day.
Grain Market News

U.S. Corn Crop Conditions

Corn crop conditions down 1% to 58% G/E. Last year was 60% but last year the 60% G/E was the low watermark for crop conditions and they inched a little higher from there. If we don’t get some better rains this week, crop conditions could slip 1% next week.
Corn Conditions by State

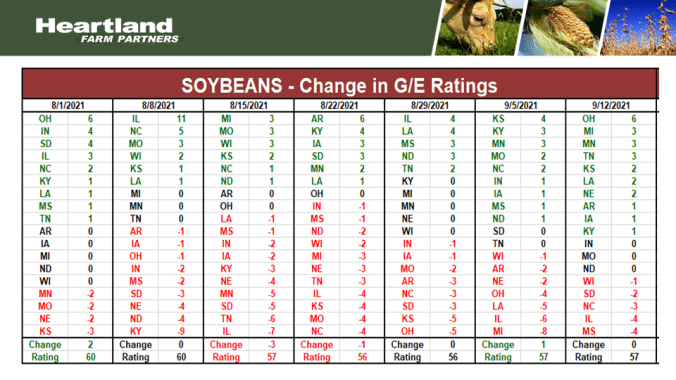
U.S. Soybean Crop Conditions

The soybean condition rating held steady at 57% G/E. Last year we were at 63% G/E and that was the low mark for the year as well. USDA is projecting this year’s yield will be above last year despite conditions being 6% below the year ago level.
Soybean Conditions by State
Grain Market News

El Nino Forecast

This chart shows the sea surface temperatures in the equatorial Pacific. The zero line indicates sea surface water temperatures are close to normal. La Nina is below average and El Nino is above average. Last year a La Nina was in place beginning early in the South American growing season and it continued through most of the South American growing season and that helped contribute to some of the corn losses in Brazil’s Safrinha corn crop. This year an even stronger La Nina is being forecasted. Instead 1.3 degrees below normal, forecasters are calling for 1.7 degrees below normal. This forecast has been getting cooler and cooler over the last couple of weeks. This doesn’t guarantee that South America will have weather problems but it does increase the odds of dryness in portions of Brazil and Argentina.
Brazil Weather

Brazil’s central and northern primary growing regions have been rain free for the past 30 days with any significant rains in the far southern region. As we look ahead to the 2-wk precipitation forecast, the rains are mostly in the southern growing region in the first week of the forecast with a little bit of rain inching its way northward in the second week. But still much of central and southern Brazil could remain completely dry for the next 2 weeks and that takes us out to Sept 30th. This is not a major concern right now but it does bear watching as South America heads towards the heart of their planting season.
High Temperatures

Weather looks pretty good for harvest with mostly 80’s and a few low 90’s across the central belt. Cooler in the northwestern belt. These temperatures are anywhere from 10-15 degrees above normal. Summer like conditions continuing. That is good for quick dry down of the crop but in areas that have missed out on rain, this heat could be pushing crops too quickly to maturity and sacrificing test weight along the way.
30-Day Precipitation – % of Normal

Looking at the past 30 days as a % of normal you can see the much improved rainfall in the northwestern belt. The same area that suffered the most severe drought has seen some of the best rains of the past 30 days. Unfortunately, over the past 30-days the eastern belt has been drying out. Anything in tan is 50% less than normal and anything in red is less than 25% of normal. When we look as the southern Plains conditions are even drier. The dryness in the eastern belt over the past month has some believe yield is being trimmed back. The dryness in the southern Plains is going to have to be monitored as we’re just starting to plant the winter wheat crop which is 12% planted compared to 9% on average.
7-Day Precipitation Forecast

Dryness continues in the central belt and southwestern Plains while heavy and possibly flooding rain could impacts areas of LA and MS. The good news is that not much wind is associated with the remanence of hurricane Nicholas so heavy rain is the biggest issue for the southern Gulf region.
6-10 and 8-14 Day Forecast

The longer-term forecast calls for well above normal temperatures in the 6-10 day as well as above normal in the 8-14 day. That should continue to push crops quickly towards maturity especially in areas that haven’t seen as much rain over the past 30 days. The forecast calls for continuing dry weather in the central, southwestern Plains in both the 6-10 day and the 8-14 day. With above normal precipitation possible in the Great Lakes and eastern belt in the 6-10 and 8-14 day forecast. The forecast does not look overly threatening but it is certainly less than ideal with many areas lacking the adequate amount of moisture for proper fill late in the season.
December Corn Chart
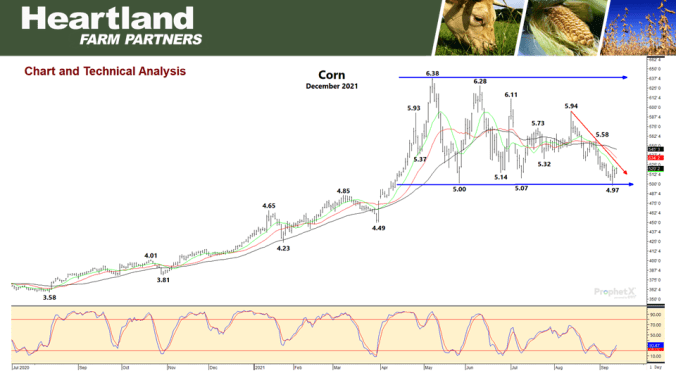
The corn chart looks pretty good. The short term has turned upward. Technicals have turned upward but we do still have some overhead resistance. We have the 10 and 20-day moving averages and a downtrending line all coming into play around the $5.25 area. We need to get through that if we want to see prices trying to trend higher. But when we combine prices near the spring and summer lows, technicals near zero, a key reversal to the upside on Friday, and a seasonal trend that shows over the past 7 years that prices hit their seasonal low in Aug or Sept, it does look quite promising for corn to break through some of this overhead resistance and try to sustain somewhat of an uptrend here in the near term.
November Soybean Chart

Soybean prices also turning a little bit higher but just gradually and the technical indicators just barely trying to turn upward as well. The short-term trend is down but we are seeing some signs of the market wanting to go higher. But we need to see a higher close and take out the key reversal from Friday before chart and technical traders get excited enough to place this thing upward. With prices near the spring and summer lows, technicals near, a key reversal on Friday, it does look quite promising for soybeans to possibly post some upward momentum over the next couple of weeks.
December KC Wheat Chart

Wheat prices made a big move to the upside today. Double digit gains. Technicals look good. It does appear the wheat market is going to be testing its overhead resistance around $7.10 and from there, if we can break through $7.29-$7.30 would be the next objective on the KC chart.

To return to the previous page on your mobile device, click the back arrow in the bottom tool bar.