To zoom in on a phone, tablet, or touch screen, place two fingers on screen and move them apart. To zoom out pinch fingers together.

Format for Today’s Special Corn Outlook

2020-21 Corn S&D

Demand for U.S. Corn 2020-21

Over a third of U.S. corn goes into feed. About a third is used for ethanol, 18-19% is shipped for exports and just under 10% goes for other foods and industrial purposes.
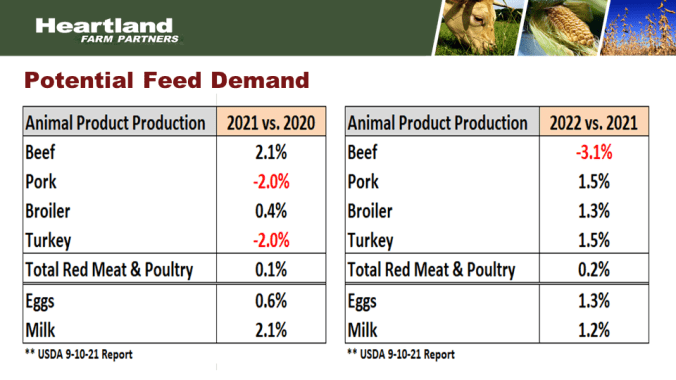
Potential Feed Demand
Weekly U.S. Ethanol Production

About a third of all U.S. corn goes into ethanol production. This chart shows the weekly ethanol production. It’s easy to see 2017-2019 we hit a plateau for ethanol production and then the Covid-19 caused a major pullback in ethanol production and since that time we’ve been gradually increase our production back up until recently. The big spike down in Aug and early Sept was due to the fact the in the U.S. we’re running out of old crop supplies. That number should increase significantly as new crop corn becomes available.
U.S. Corn Exports

The third largest category of corn following feed and ethanol is corn that is shipped for exports. The crop year that just ended, the U.S. had record exports at 2.745 bb of corn.
Total U.S. Corn Use

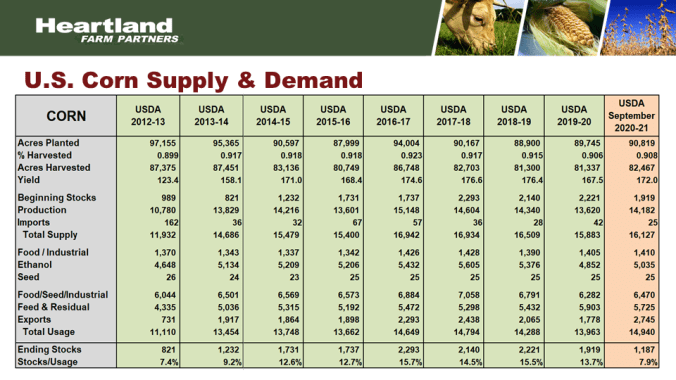
Our old crop corn use just shy of 15 bb, an all-time record amount of corn used. This number would have even been bigger for feeds, exports, and ethanol if we hadn’t been on the verge of running out of supplies prior to this year’s harvest.
U.S. Corn Supply & Demand
2021-22 U.S. Corn Outlook

U.S. Planted Acres

The supply side starts with acres that were planted last spring. The U.S. planted 93.3 mil acres of corn, 87.2 mil acres of beans, and 46.7 mil acres of wheat. This is the updated information as of USDA’s Sept crop report. It’s worth noting that corn, bean, and wheat acres have all increased this past year. A lot of that is due to the fact we have not had much prevented planted compared to the previous 2 years.
U.S. Planted Acres Combined

Total planted acres for corn, beans, and wheat this year 227 mil acres. That is down from the high price years of 2013 and 2014 when we planted 230 mil acres. We must keep in mind that at least 0.5 mil acres per year goes to urban sprawl. Whether its highways, housing developments, or solar panel farms, we lose 0.5 mil acres plus per year. So 7 years ago means we’ve lost 3.5 mil acres of primary farm ground since 2014. This is likely very close to a maximum planted area unless we steal acres from other crops.
U.S. Prevented Plant Acres

Prevent plant was down to 1.266 mil acres of prevent plant this year for corn, beans, and wheat. That is near the record low from 2012. So as we look ahead to next year, prevent plant can’t get much lower than it was this year. And again, evidence that this year’s acreage was nearly maxed out.
CRP Acres

Another item that can contribute to our planted areas are CRP acres. We maximized CRP acres in 2017 at 36.8 mil acres. Since then we’ve been declining every year until this year’s low of 20.8 mil acres of CRP. But the Biden Administration has a gameplan to try and increase the acres in the CRP program and maximize that program over the next couple of years. Whether they are successful or not is yet to be determined but already know that enrollment exceeded acres that were expiring this year so CRP acres should see a small increase next year but we will not be gaining any additional acres from the CRP program heading into next year’s growing season.
Weather

6-Month Precipitation vs Average

This year when we look at 6 months of precipitation. If you draw a line from Kansas City to Chicago, north and west of that line mostly below normal precipitation. South and east of that line mostly above normal precipitation. Now 6 month precipitation does not tell us what our yields are because it depends on the timing of that rain as well.
U.S. Drought Monitor: September 14, 2021

North of the line for Kansas City to Chicago is where we have drought conditions including severe drought in the Pacific northwest. In the eastern and southern belt into the central Plains, not much for drought at this time.
U.S. Corn Crop Condition

We’ve had some challenges with dryness throughout the year and crop conditions for corn currently at 59% G/E. Slightly below last year’s crop rating that was 61% G/E. Keep in mind, that last year’s yield was 172 bpa. USDA is projecting this year’s yield to be 176.3 bpa.
U.S. Corn Yield

In the May, June, July timeframe USDA was using a trendline yield of 179.5 bpa until they had a better feel for weather and crop potential. Heat and dryness during portions of May, June, and July had USDA lowering its estimate of the U.S. yield to 174.6 bpa in the Aug crop report but USDA then raised the yield to 176.3 bpa in the Sept crop report despite lower crop conditions. This yield at 176.3 bpa was a surprise to some and caused the market to set back. A number of analyst within the trade believe our yield will fall short of USDA’s projection in the Sept crop report at 176.3 gpa.
U.S. Corn Yield

Looking at a long-term chart, the thick red line would be the long term linear trend or trendline yield. This year’s trendline yield 179.5 bpa, just a fraction below the 180 bpa level. USDA is currently projecting a yield just slightly below trend at 176.3 bpa and it would be very close to the all-time record yield of 176.9 bpa.
U.S. Corn Production

When we combine our yield at 176.3 bpa and our harvested area which is estimated 85.1 mil acres, you get production at just 14.99 bb, just below 15 bb of corn production this year. That would be the second largest production on record.
U.S. Corn Supply & Demand

Items that May Influence the Markets

Crude Oil
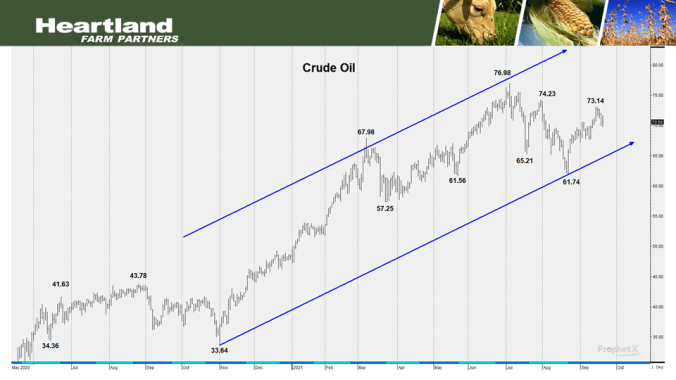
This chart shows the crude oil markets and we’re stabilizing around the $70/barrel level. Compare that to a year ago when we were stabilizing around $40/barrel. Much higher crude oil prices versus a year ago is good news and supportive for corn and soybean oil.
U.S. Dollar Index

A lower U.S. dollar means that U.S. products are cheaper for U.S. for global buyers. Therefore, if we want strong exports a relatively low U.S. dollar index is a good thing. Currently the U.S. dollar index is trading around the 93 levels. That’s up from the lows in May and June but it’s down significantly from a year and a half ago. In fact, that 93 level where we’re trading right now is very close to where we were a year ago.
Global Drought Monitor

South America had a severe drought. Brazil’s northern and northwestern corn growing region experience severe drought and it really did a number on their Safrinha corn crop. In fact, Brazil’s Safrinha corn crop lost about a billion bushels of production due to drought. It’s also worth noting that Argentina’s growing region that they’re having some moderate drought issues as well. It is just now entering their planting season but it is something that will need to be monitored going forward.
El Nino/La Nina Forecast

This graph is from NOAA and shows the sea surface temperatures in the equatorial Pacific. The zero line is where sea surface temperatures are about average. Anything above zero would be El Nino. Anything below average would be considered La Nina or colder than normal sea surface temperatures. The heart of South America’s growing season is Nov-Feb. Last year we had La Nina which was setting in when South America was planting and we remained in a La Nina position right through their growing season. Sea surface temperatures this year are cooling off. They’re below average and it’s projected we’ll have another La Nina, again beginning at their planting season and lasting through their growing season. In fact, this year’s La Nina is forecasted to be even stronger than last year. This does not guarantee that South America will have drought or unfavorable weather but it does bear watching.
Items that May Influence the Markets Cont.

U.S. Corn Ending Stocks

Corn ending stocks at just 1.187 bb and stocks to use similar to 2013-2014. USDA is projecting stocks to increase and that has taken a little bit of pressure off the markets with harvest approaching as well. This ending stocks projection of 1.4 bb could easily be at or below last year’s 1.187 bb.
U.S. Soybean Ending Stocks
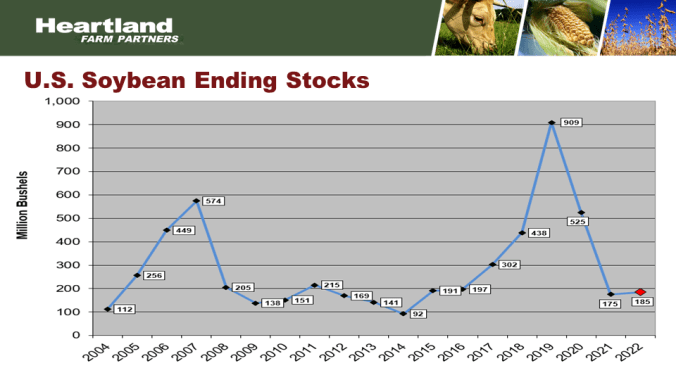
Soybean stocks extremely tight this past year at 175 mb. Projected to be extremely tight again next year. So soybeans do not look like they’re in a position to see any major price break. In fact, we’ll be looking for an increase in acreage due to the significant increase in renewable diesel that is being projected by the industry.
U.S. Wheat Ending Stocks

U.S. wheat ending stocks expecting to see a major pullback again. It would be the 5th year in a row of reduction in wheat stocks. Keep in mind, global wheat stocks are tight as well.
U.S. Grain Stocks
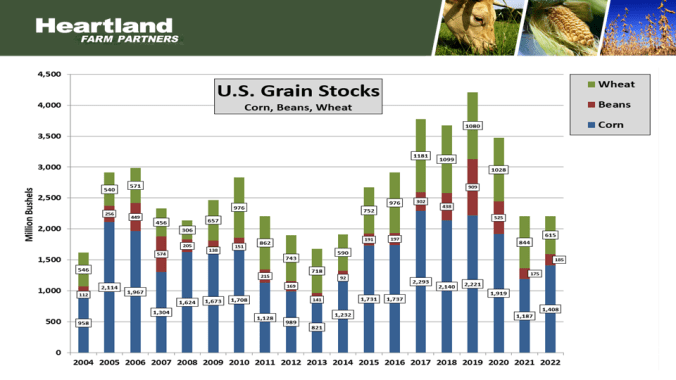
Corn, beans, and wheat stocks this coming year expected to be about equal to what we were this past year which is an extremely tight level. When we look at stocks to use in the coming year, it’s going to be similar to what we saw in the tight stock years of 2010-2013.
Corn Monthly Chart

It would be very natural to ask if the rally of 2021 is over and we’re headed back to $3-$4. We were there for 6 years in a row but these were years of surplus corn as well as surplus beans and wheat as well. When we look at years of shortage, at the 2010-2013 where we spent most of the time between $5.50-$7.50 for 2 ½ years. This past spring we rallied corn up to the $7.50 type level due to shortages of corn and beans. We could be tight on corn, beans, and wheat next year. Prices have re-treated towards the $5 level over the past couple of weeks but that was a bearish crop report, combined with the U.S. Gulf shutdown due to hurricane Ida, add in the pandemic resurgence of Covid-19 primary through the Delta variant and then this week concerns regarding China surfaced when Evergrande Corp, China’s largest real estate developer missed a debt payment and that caused concern. All of these items have pushed us down to a level that is likely at the very low end of fair value. Don’t be surprised to see prices work back higher as we move towards next spring. We are going to have a tight balance sheet this year. That is almost a certainty. Any threat to South American or U.S. production this winter or into the spring and summer growing season could cause extreme volatility, similar to what we saw this past year. The bottom line is current corn prices are at the very low end, if not below fair value given the supply and demand scenario that is set up going into next year.

To return to the previous page on your mobile device, click the back arrow in the bottom tool bar.