
Today’s Prices

Grain prices finished mixed today as the market tries to digest yesterday’s USDA crop report and look ahead to weather items of next week.
Weekly Price Summary

Grain Market News

U.S. Corn Ending Stocks

Our current year crop stock was unchanged at 1.44 billion bushels.
New crop stocks estimated at 1.36 but this was well above what the trade was expecting and considered lightly negative.
It is projected that this year’s stocks will be in the 1.1-1.2 billon range, if that’s true that will be the lowest going back to the drought years following 2012.
U.S. Soybeans Ending Stocks

Our current crop year is at 235, down 25 million bushels from last month and it is above last year’s ending stocks of 257.
Next year USDA is projecting stocks will increase to 310 million bushels.
Even though stocks are projected to be higher next year this estimate at 310 was below the average trade guess.
U.S. Wheat Ending Stocks

USDA projected the stocks would drop next year and many believe that this number could be down closer to 500.
We would be looking at some of the tightest stock for U.S. wheat going back about 15-16 years.
U.S. Grain Stocks

This year’s stock projected to be very close to last year’s stocks, this year being end stock for 2022 which ends late this summer on August 31st.
Keep in mind that this total is likely going to slip lower for corn and soybeans and next year’s stock many believe are going to be well below what the current USDA is estimating.
Global Wheat Ending Stocks

This year’s stock expected to be slightly below last year’s stock, next year’s stock slightly lower again.
Not a major change, but we have global stocks declining while global demand is rising.
That means that our stocks to use for global grain is getting event tighter.
High Temperatures

The U.S. has had very good weather in the central, southern, and eastern portions of the belt at least most of areas.
Temperatures in the low to mid 90’s is not a problem when the crop needs to be planted or germinated.
The warm weather is quite beneficial for the majority of the belt.
7-Day Observed Precipitation

The Dakotas and Minnesota are seeing excessive moisture, from 1-5 inches of rain in most of the northern plains and northwest belt. Even an area with 5-8+ inches in Minnesota.
30-Day Observed Precipitation

That heavy rain in the northern plains and northwestern belt is causing excessive moisture and flooding in some parts.
30-Day Precipitation- % of Normal

Almost all of North Dakota, South Dakota, and Minnesota has seen 2-4 times the normal amount of precipitation. Some areas have seen 6x plus the normal amount over the last month.
This is clearly causing server planting delays and some cases severe flooding.
U.S. Rivers in Flood Stage

Many of the rivers that were in flood stage in the eastern belt last week due to heavy rains are now seeing those rivers levels subside and much less flooding in the eastern belt.
The northern plains continue to see flooding in the Red River Valley and additional flooding in Minnesota and South Dakota as well.
7-Day Precipitation Forecast

Show’s rains wrapping up today for the most part in the northern belt and northern plains. Then we should get a little break in that area of the Dakotas and Minnesota’s.
We do have rain coming into the central and eater belt over the next 7 days where 1-1.5 inches could fall which would be beneficial for those farmers who have planted.
July Corn Chart
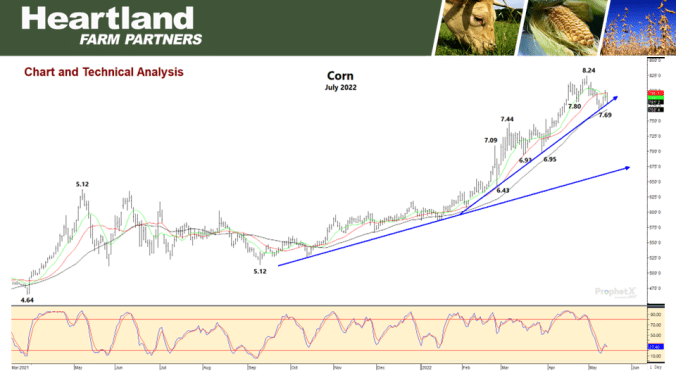
Corns prices found chart support early this week down at the 40-day moving average and where our uptrend line comes into play.
Today markets bounced back down and testing that level again.
We can’t rule out the market testing this week’s lows at 7.69 but overall, we are not looking for a bearish trend to develop.
July Soybean Chart

Soybean prices look very good on a chart exploding to the upside recently.
Beans have rallied 73 cents off of Mondays low and the technical indicators have turned nicely.
We have now achieved our first objective at 16.50-16.60, which is mid-range on our price chart and where the 20- and 40-day moving average comes in to play.
If we get friendly news next week, we could expect prices to attack the upper half of the range.
July KC Wheat Chart

Wheat prices have exploded to the upside rallying over $2 in less than 2 weeks.
Prices have now surged into new contract highs taking out the high of 12.59 from March.
This explosion to the upside has also taken our technical indicators well into the overbought range.
Questions or Comments

To return to the previous page on your mobile device, click the back arrow in the bottom tool bar.