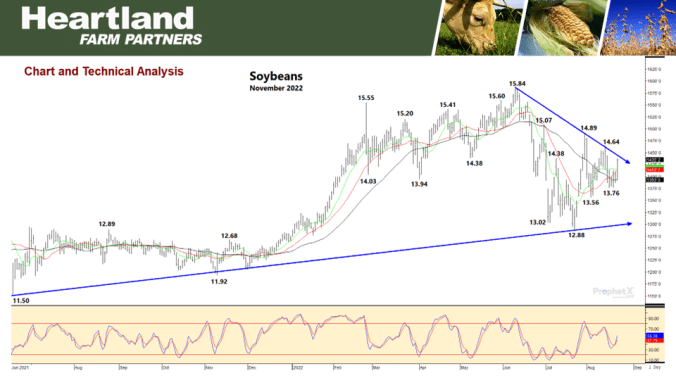
Soybean prices look similar to corn, and they moved higher today making and high for this move over the last week or so.
The overall chart looks good, moving averages are lining up and crossing over the 40 day, and the only hick up we are coming close to overhead resistance from the downtrend line that’s been in place off of the June highs.
The current trend is up and that’s enough to have the technical turn up as well.
Overhead resistance lying close to 14.50, 15 cents above todays close.