To zoom in on a phone, tablet, or touch screen, place two fingers on screen and move them apart. To zoom out pinch fingers together.

Format for Today’s Special Corn Outlook

2020-21 Corn Demand Outlook
Demand for U.S. Corn 2020-21

When we look at U.S. demand for corn this pie chart shows where corn is used. The largest demand category is feed and residual at 38% of total U.S. corn used. Ethanol consumes just shy of 34%, so a close 2nd while export this year expected to be about 18% total use and then additional food and industrial use accounts for a little bit less than 10%. Over 90% of corn in the U.S. is used for either feed, ethanol, or exports.
Potential Feed Demand

Weekly U.S. Ethanol Production

The second largest demand category in the U.S. is corn use for ethanol. This chart shows ethanol production over the last 11-12 years. It’s clear to see we had a major reduction in ethanol production due to covid back in 2020 and then this year we had a sharp spike due to the freeze and ice conditions that shut down a number of ethanol plants in early 2021. But for the most part, ethanol production has rebounded back to a similar level we from 2017 up until the pandemic in early 2020. USDA’s corn use for ethanol estimate for this current year is 5.075 bb. That would be up 4.6% from last year which was reduced due to covid. Currently ethanol production is running up 3.2% and so at this point we’re running just a little behind USDA’s target.
U.S. Corn Exports

The U.S. third largest demand category is corn shipped for exports. This year’s exports, although they were reduced last month, at a record level of 2.775 bb. Strong demand from China one of the leading factors giving us the big exports this current crop year.
Total U.S. Corn Use

USDA is projecting total corn use at an all-time large demand at just over 15 bb.
U.S. Corn Supply & Demand

2021-22 U.S. Corn Outlook

U.S. Planted Acres

Supply and demand for the new crop year begins with the supply and that begins with the number of acres we plant. USDA from their June acreage report is estimating corn acres will be 92.7 mil, beans at 87.5 mil acres, and wheat at 46.7 mil acre. All of these significantly increased from a year ago.
U.S. Planted Acres Combined

When we look at corn, beans, and wheat combined we can see just shy of 227 mil acres and up significantly from last year’s prevent plant reduced and then 2 years ago when prevent plant was even larger. We’re now approaching that maximum planted level that we had following the high prices and drought of 2012. But we also have to keep in mind that urban sprawl is eating up about .5 mil acres of corn, beans, and wheat ground. Some people say if you combine hay and other crops it could over 1 mil acres. But even at 0.5 mil over the last 8 years, we could be reducing our total available acres by about 4 million. This almost 27 mil acres is about maximum planted capacity and its going to be very difficult to get that number to increase next year.
U.S. Prevented Plant Acres

One of the reasons it’ll be difficult is that our prevented plant numbers. When we look at the last 15 years, this year at 1.229 mil acres of corn, beans, and wheat prevented plant. That’s about as low as you can ever get so we’ve maximized our planted area already this past year. Again, we need to remind our viewers that we need acreage expansion and that is not going to be an easy task.
Weather
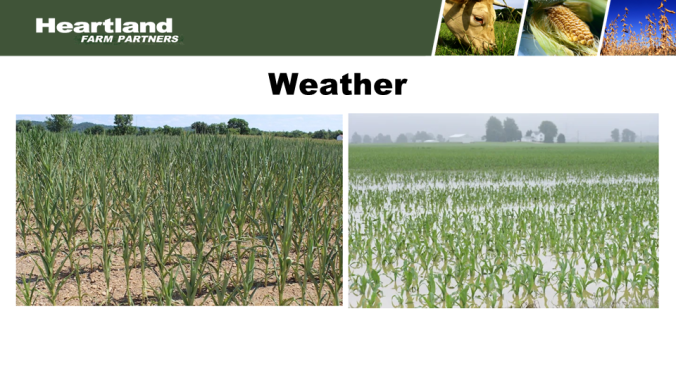
Weather is the biggest determining factor when it comes to yield.
Calculated Soil Moisture Anomaly

This map shows soil moisture as of Aug 16th compared to normal. It’s clear to see the northern Plains and the northwestern belt has not only extremely short soil moisture but they’re in drought conditions. Quite a contract compared to back in June when we had exceptionally heavy rains and standing water in portions of MO and IL. For the most part if we arch the line over from Chicago to Kansas City, that’s about the line where we have dry soil to the north and west and pretty good conditions to the south and east.
90-Day Precipitation vs Average

The 90-day precipitation map shows that same pattern. Relatively dry, below normal precipitation over the last 90 days to the northwest and average to above in many areas south and east from that line from Chicago arching to Kansas City.
U.S. Drought Monitor: August 10, 2021

When we look at the drought monitor as of Aug 10th it shows what you might expect. Everything north and west of a line from Chicago to KC is dry or even in drought conditions. South and east overall in pretty good shape.
U.S. Corn Crop Condition

Corn crop conditions is one of the indicators we can use to determine how the crop is doing. Early in the growing season we got corn planted and it was looking very good but dry weather has allowed the corn crop to gradually decline and our crop conditions as of this past week are at 62% G/E. That’s the lowest rating of the year and a little below average. Many of our good growing years like 2014-2018 had very good conditions. We’re not as low as 2012 or 2002 but overall, U.S. corn crop conditions are slightly below average for mid to late August.
USDA Corn Yield Estimate

The dry conditions combined with lower crop ratings and USDA’s farmer survey indicated a U.S. corn yield in last’s Aug crop report at 174.6 bpa. That was down 4.9 bpa from the trendline yield that USDA was using through the July crop report. It would not be impossible to see the corn yield maybe improve a little bit from here or decline a little bit from here. I think at this point it’s safe to say 179.5 bpa, a trendline yield may be out of reach.
U.S. Corn Yield

Our long term 45 year corn yield trend shows this year yield at 174.6 bpa would be below the long term trendline yield which would be 179.5 bpa. This year’s dryness in the northern Plains is certainly tugging yields just a little bit below trend.
U.S. Corn Production

When we take USDA’s acres and we’ll use their harvested acres of 84.5 mil and multiple that by the yield this year that USDA is projecting at 174.6 bpa and USDA is calculating a 14.75 bb. That would be the 2nd largest crop on record for the U.S.
U.S. Corn Supply & Demand

Items that May Influence the Markets

Crude Oil

Crude oil has stabilized over the last 3 months but well above where we were in last August when we were in the $40-$43 range.
U.S. Dollar Index

The U.S. dollar index is a factor. When the dollar index is high that is not good news for exports because it makes the U.S. product higher priced. When the U.S. dollar index is lower it makes our exports more affordable for world buyers. The U.S. dollar has been in a long-term downtrend going back to early 2020. This year the dollar index has stabilized. At this point we have a stabilizing dollar and a stabilizing energy market. They are not providing any major influence at this time.
Items that May Influence the Markets Cont.

U.S. Corn Ending Stocks

This year’s corn stocks at 1.117 bb, very tight. Maybe not as small as previous years but demand is much larger so stocks to use equally tight this year. And even though next year USDA is projecting 1.242 bb, we believe that number could end up around a billion or even lower.
U.S. Soybean Ending Stocks

Soybean stocks extremely tight and next year, the second year in a row at 155 mb and just 3.5% Stocks to Use. No room for error in the U.S. soybean balance sheet next year either.
U.S. Wheat Ending Stocks

When looking at U.S. wheat stocks, they have been declining gradually for the last 3-4 years. Then a larger decrease this year and next year another large decrease, projected at 627 mb. Getting back down towards some of the lowest levels we’ve seen over the last 10-14 years.
U.S. Grain Stocks

This chart shows that fact that when we combine corn, beans, and wheat stocks together, this year we had extremely tight stocks similar to the post drought era but again, demand is stronger so stocks to use is just as tight or even tighter than back then. And unfortunately based on USDA’s number they’re projecting even lower stocks next year. We have the very strong probability of a second consecutive year of extremely tight grain stocks in the U.S. We want to point out where the stocks levels are compared to the where we were at in the 2012 post drought timeframe and that gives us a hint at what we might expect for prices.
Corn Monthly Chart

This chart is 25 years of corn prices and back in 2014-2020 we had relatively low prices from $3.00-$4.40 for 5 or 6 years. Those years had cheap prices. Those are years of surplus supply. But we also need to look back at the 2010-2013 timeframe when prices were above $5.50 for two and a half years. From late 2010 to early 2013 the market pulled back down to $5.50 just one time with prices spending a lot of time in the $5.50-$7.50 range. In other words, it wasn’t just one spike. Prices remained elevated for an extended period. And those were years of storage of U.S. corn. This year, 2021 we’re short again. Prices have been ranging between $5.50 and $7.50. Like what we saw from 2010-2013 and it looks like from USDA’s numbers we will have another year of shortages this coming year, 2022. Anything within this range if fair game. We’re not expecting prices to rally to $7 any time soon because we do have a crop that needs to be harvested. Prices could remain between $5.50-$6.00 during harvest. But by the time we get to spring prices could be well above the $6 level and whether we go to $7 or $7.50 will be based on additional weather scares. If there’s a weather scare in Brazil or a weather scare in the U.S. next spring, prices could certainly go higher. Even without a weather scare we think that by the time we get into late winter, spring, or early summer prices could spend a lot of time in the $6.00-$6.50 level. And as we mentioned, weather will determine if we can go higher from there. Under the current tight supply or shortage situation, price below $5.50 likely not to last very long or go very deep with current prices at $5.60 today, at the lower end of the expected range going into next year’s growing season.

To return to the previous page on your mobile device, click the back arrow in the bottom tool bar.