To zoom in on a phone, tablet, or touch screen, place two fingers on screen and move them apart. To zoom out pinch fingers together.

Today’s Prices

Grain prices were higher today based on lower crop condition ratings and much stronger outside markets.
Grain Market News

Corn Crop Condition

Another positive item for the grain markets today is a fact that crop conditions were down yesterday. The U.S. corn crop condition fell 2% for the second week in a row and is now at the lowest level of the year at 60% G/E and 4% below last year.
Corn Conditions – State by State

Soybean Crop Condition

Soybean crop conditions fell 1% down to 56% G/E. That is the lowest rating of the year and well below last year’s rating of 69% G/E.
Soybeans Conditions – State by State

Grain Market News

High Temperatures Monday 8-23-21

Yesterday from Sioux City IA down to St Louis saw temperatures in the mid and upper 90’s with lots of 100’s in the Plains. This temperatures profile from Sioux City IA to St Louis and south could see a lot of additional heat for the balance of this week. It’s also worth noting high temperatures in the eastern belt could be in the low 90’s all week as well and in dry areas that is going to cause significant stress.
U.S. Radar

The radar shows rains in northern IA. Those are moving to the east. Crop conditions could improve in portions of eastern SD, much of MN, and northern IA over the next week. Unfortunately, areas to the south, southeast, and southwest of that area could all see crop conditions declining going forward.
7-Day Observed Precipitation

Over the past 7 days you can see the eastern belt has received very little to no rain. Southern IA and northern MO little to no rain and out in the southwestern Plains very little to no rain as well as a pocket from portions of SD into northeast NE.
14-Day Observed Precipitation

Over the past 14 days we can still see that pocket from southern IA into portions of SD and eastern NE, central IN, and portions of the southern/southwestern Plains very little rain over the last 2 weeks and although some of those areas may have good subsoil moisture, things are drying out quickly with the heat this week.
U.S. Soil Moisture

This week’s soil moisture 47% short to very short for the U.S. corn and soybean acres. That is nearly half of the acres that produce corn and soybeans showing short to very short moisture. That’s the driest we’ve been for this time of year going back to the drought of 2012 and the second driest since 2007. We’re not having any type of a disaster for U.S. corn and soybean yields this year nationwide but when nearly half of the crop is short to very short, it’s tough to get the optimal fill on crops without moisture.
7-Day Precipitation Forecast

We mentioned the northern belt could see additional rain, 1-3” of rain from northern IA, northern IL and north into MN and ND with some areas in eastern MN and WI seeing 3-5” over the next 7 days. Over the next 7 days. But south and west, not much rain in the forecast and that is where we could see crop conditions slipping which would offset improvements in the northern and northwestern belt.
6-10 and 8-14 Day Forecast

The 6-10 and 8-14 day forecasts do show above normal temperatures continuing but moisture doesn’t look too bad. Much of the belt should have average to above average precipitation over the next 2 weeks. We could call the forecast, in general, non-threatening.
December Corn Chart

Corn prices moved to the upside, turning the corner and showing some signs of a better chart formation and it was enough to turn the technical indicators up as well. With this in mind, both the charts and technicals are showing signs of putting in a fairly significant bottom yesterday. Now we’ll be looking for the market to move back towards the middle of its range based on chart and technical formation.
November Soybean Chart
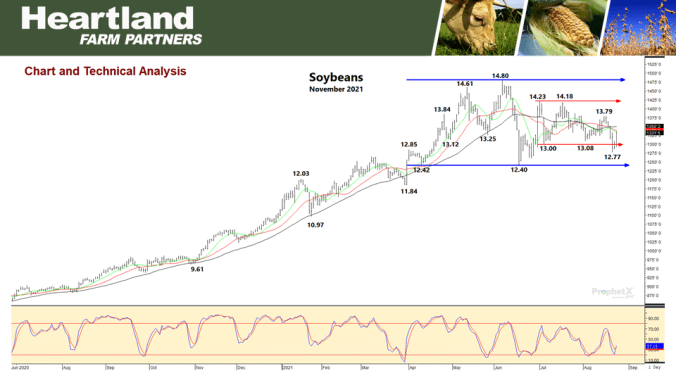
Soybean prices also turning higher today. Enough to turn the technicals higher as well and soybeans also from a chart and technical perspective look like at a minimum we can test the middle portion of the range. That doesn’t mean that’s the top. That would just be the initial object and if we can get a little bit more friendly news then we can maybe talk about challenging the upper end of the range that has been in place going back to late June or July.
September KC Wheat Chart

Wheat prices stabilizing but not rallying like we saw in corn and beans. Wheat is trying to find some bottoming action but nothing concrete on the wheat chart or technicals. Another day of steady to a little high prices could turn the chart, could turn the technicals and allow wheat to somewhat follow what we’re seeing in corn and beans.

To return to the previous page on your mobile device, click the back arrow in the bottom tool bar.