Grain markets finished sharply lower across the board for the second day in a row as Chinese corn cancellation and an extension of the corridor encouraged heavy selling.
Grain Market News
U.S. Radar
Virtually the entire US corn and bean belt is rain free as of midday today and the rains that do fall over the next week look to be light.
7-Day Observed Precipitation
The forecast shows mostly 1-3 tenths across the majority of the belt.
Heavier rains are projected for the southern and southwestern plains.
Outlook
Warmer temperatures move south and east in the 6-10 days and continue into the 8-14 days.
We will see a dryer pattern in the eastern belt in the 6-10 and 8-14.
Soil Moisture
Soil moisture will decline between now and May 30th if the forecast is correct.
Grain Market News
Sea Surface Temperatures
Zero means that the water temperatures or sea surface temperatures are close to average.
Anything a half degree below normal is considered La Nina and anything a half degree above normal or higher is El Nino.
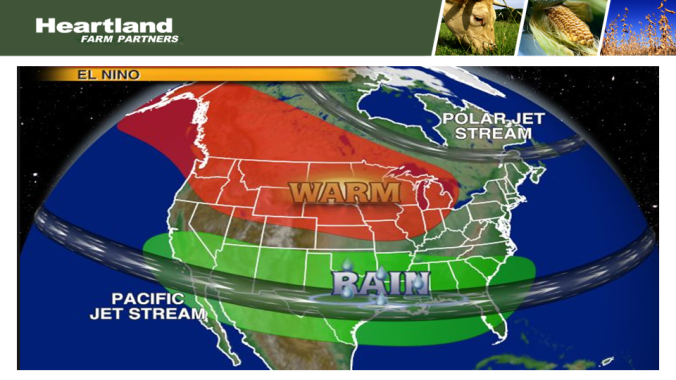
At this time sea surface temperatures are just now entering into the El Nino phase.
El Nino
No El Nino is created equal they all create different weather scenarios.
In general, El Nino is associated with cooler, wetter conditions across the far southern portion of the U.S.
El Nino
Cooler, wetter conditions in the south and warmer conditions in the north.
Weekly Ethanol Production
Ethanol production increased to 987 thousand barrels a day, that’s the best out of the last 4 weeks but still below the level needed.
Ethanol margins are estimated to be very profitable at this time.
When it comes to the ethanol industry the sharply lower corn market is certainly beneficial.
Our year-to-date ethanol production is slightly below the target, but we wouldn’t be surprised to see it strengthening with the favorable margins.
Weekly Stocks of Fuel Ethanol
Stocks decline seasonally, you can see a seasonal trend on stocks as we move through April/May and into June.
The good news is the current stocks at 23.198 million barrels are 2.5% below the year ago level.
May Corn Chart
Corn prices down sharply, we had been stuck in a sideways range for three weeks.
Today’s break to the downside caused very aggressive fund selling and a low of 5.54.
Wheat closed at 5.61.
The funds are now building a large short position in the market.
May Soybean Chart
Soybeans are expected to have a volatile trade this season.
Todays break down to 13.32 is a surprise that we would fall this far this quickly.
This has pushed our technical indicators back into the oversold range.
There was no sign of bottoming action today, but we will be watching the next couple of days.
May KC Wheat Chart
Wheat is almost a flip flop of 180 degrees where the market has been rising sharply the past couple of weeks.
We had a reversal today after posting a new high earlier today at 9.18. We turned around and closed at 8.85.
The trend is still upwards for wheat, but today’s reversal down was certainly a negative signal.
Grain markets finished sharply lower today as U.S. weather looks pretty good, the trend for new crop corn and beans is down, and economic data is not positive.
Grain Market News
U.S. Corn Planting Progress
Corn is at 65% complete, that is ahead of the 5-year average which is 59%.
The weather forecast looks good enough that planting should advance nicely into the low or mid 80s for next week.
U.S. Soybean Planting Progress
Soybeans are at 49% complete compared to 36% on average.
We expect next week will be in the mid to upper 60s.
Winter Wheat Conditions
Wheat was left unchanged at 29% good to excellent, which is slightly above last year’s rating.
U.S. Topsoil Moisture
As of last week, 25% of U.S. corn and bean acres were short to very short and this week that is down to 17%.
7-Day Precipitation Forecast
For nay acres that are not planted we have a relatively dry forecast across most of the belt.
If you happen to be in a dry pocket, a forecast for just one or two tenths of rain is not very much so you may be disappointed.
Grain Market News
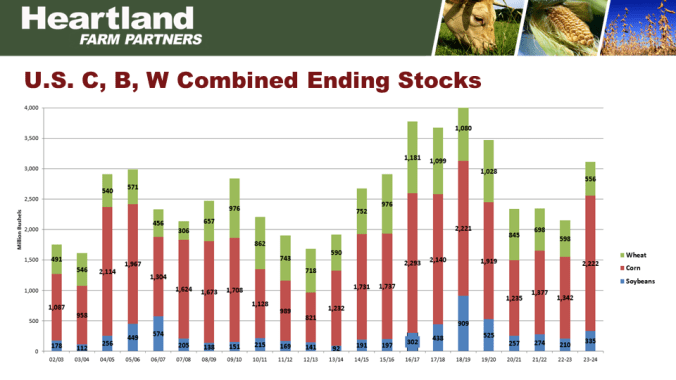
U.S. Corn Ending Stocks
New crop ending stocks are forecast at 2.222 billion bushels, that is a huge increase from this year.
U.S. Soybean Ending Stocks
Soybeans are projected at 335, this year stocks at 215.
Nonetheless USDA is projecting a big increase in stocks next year based on record yields for soybeans this year.
U.S. Wheat Ending Stocks
Wheat shows that next year’s stocks projected at 556, this would be the 7th year in a row of a decline in wheat stocks.
Combined Stocks
USDA is projecting a significant increase above our current stock, maybe not as high as the 2016-2019 timeframe, but there will be an increase.
May Corn Chart
Corn has shown a very choppy trade over the last 3 weeks.
Mostly from $5.70-$6, so about a 30-cent trading range.
The current chart support at the lows posted 2 weeks ago at 5.69 with overhead resistance at $6.
May Soybean Chart
Soybean prices made a new low for the move today down at 13.85.
Technical indicators are back in the oversold range.
There is no sign of bottoming action, but this is no place to be making sales.
May KC Wheat Chart
Wheat rallied $1.76 in 2 weeks from the lows on May 2nd at 7.36 to the high yesterday at 9.12.
Wheat closed at 8.95.
Dryness developing in the Canadian prairies where a lot of spring wheat is grown, some dryness in Russia’s wheat crop region, as well as the question mark as to if the Ukrainian Shipping Corridor will be renewed all contributing to this big bounce.
Grain markets finished higher today, rumors that Russia may not allow the continuation of the shipping corridor supported the bounce.
Weekly Price Summary
Grain Market News
Corn Production
Grain Market News
U.S. Drought Monitor
Class Change
High Temperatures
Soil Temperatures
U.S. Radar
7-Day Precipitation Forecast
Low Temperature Forecast
May Corn Chart
Corn prices shot to the upside today, today’s high at 6.68 matches the high from about 2 weeks ago.
Overall today’s move makes the chart look good and was enough to turn the technical up.
Prices are now approaching overhead resistance at the 6.68-6.70 range.
May Soybean Chart
Soybeans prices were disappointing today with an outside day down.
We did hold chart support and we did close near the upper end of the range.
Bottom line is soybean prices have been chopping back and forth over the last couple of weeks leaving the technical chopping.
May KC Wheat Chart
Wheat prices looked good today after testing chart support.
Wheat prices exploded to the upside and closed near the daily high which makes the chart look good and the technical trying to hook upward as well.
Unless we get bearish news it does look like this market may be interested in testing the area of 9.02-9.09.
Recommendations
Questions or Comments
Today’s Prices
Grain markets finished higher today, rumors that Russia may not allow the continuation of the shipping corridor supported the bounce.
Weekly Price Summary
Grain Market News
Corn Production
Grain Market News
U.S. Drought Monitor
Class Change
High Temperatures
Soil Temperatures
U.S. Radar
7-Day Precipitation Forecast
Low Temperature Forecast
May Corn Chart
Corn prices shot to the upside today, today’s high at 6.68 matches the high from about 2 weeks ago.
Overall today’s move makes the chart look good and was enough to turn the technical up.
Prices are now approaching overhead resistance at the 6.68-6.70 range.
May Soybean Chart
Soybeans prices were disappointing today with an outside day down.
We did hold chart support and we did close near the upper end of the range.
Bottom line is soybean prices have been chopping back and forth over the last couple of weeks leaving the technical chopping.
May KC Wheat Chart
Wheat prices looked good today after testing chart support.
Wheat prices exploded to the upside and closed near the daily high which makes the chart look good and the technical trying to hook upward as well.
Unless we get bearish news it does look like this market may be interested in testing the area of 9.02-9.09.
Recommendations
\Questions or Commentstions or CoWheat prices had a massive move today challenging contract lows of $7.36 overnight last night turning around and closing at $7.85 49 cents off the daily low. This was a massive reversal to the upside, very impressive not only from the fact we closed 44-45 cents higher, but certainly shows up as a significant move on the chart turning the technical indicators up as well. Certainly the wheat market looks like it confirmation of bottoming action today.
Today’s Prices
Grain markets finished mixed today following USDA’s May crop report.
Weekly Price Summary
Grain Market News
U.S. Wheat Production
U.S. Ending Stocks
South American 2023 Production
World Ending Stocks 2023
Grain Market News
7-Day Observed Precipitation
Planting has been aggressive, and we have been getting some good rain across the bulk of the belt.
High Temperatures
In addition, temperatures have been quite favorable.
Upper 70s to mid-80s across the entire corn and bean belt.
7-Day Precipitation Forecast
The forecast calls for rain in the northern plains and far northwestern belt and the southwestern plains could get heavy rain.
Most of the rest of the U.S. corn and bean belt is looking for just moderate rains.
Outlook
The outlook shows warmer temperatures to the north and west, closer to average in the central and east in the 6-10, that carries over to the 8-14 day as well.
As far as precipitation is generally below normal for most of the belt in the 6-10 and the 8-14 except for the far southern region where it could be wetter.
May Corn Chart
Corn is stuck near the lower end of our range.
July corn did close higher today and that was positive, but we didn’t get bullish news.
Corn closed at 5.86, up 4 cents.
May Soybean Chart
Soybeans are near the lows that were posted in March and that’s about the lowest level we’ve seen going back 10 months.
Soybeans are in a downtrend off some highs posted in March and today’s low is very close to the bottom of the recent range.
Beans closed at 13.90, down 16 cents.
May KC Wheat Chart
Wheat prices explode to the upside hitting 8.99 which is the highest level we have seen back in November and December.
Technical indicators are overbought but the wheat market does have some momentum following today’s report.
Grain markets finished higher today, rumors that Russia may not allow the continuation of the shipping corridor supported the bounce.
Weekly Price Summary
Grain Market News
Corn Production
Grain Market News
U.S. Drought Monitor
Class Change
High Temperatures
Soil Temperatures
U.S. Radar
7-Day Precipitation Forecast
Low Temperature Forecast
May Corn Chart
Corn prices shot to the upside today, today’s high at 6.68 matches the high from about 2 weeks ago.
Overall today’s move makes the chart look good and was enough to turn the technical up.
Prices are now approaching overhead resistance at the 6.68-6.70 range.
May Soybean Chart
Soybeans prices were disappointing today with an outside day down.
We did hold chart support and we did close near the upper end of the range.
Bottom line is soybean prices have been chopping back and forth over the last couple of weeks leaving the technical chopping.
May KC Wheat Chart
Wheat prices looked good today after testing chart support.
Wheat prices exploded to the upside and closed near the daily high which makes the chart look good and the technical trying to hook upward as well.
Unless we get bearish news it does look like this market may be interested in testing the area of 9.02-9.09.
Recommendations
Questions or Comments
Today’s Prices
Grain markets finished higher today, rumors that Russia may not allow the continuation of the shipping corridor supported the bounce.
Weekly Price Summary
Grain Market News
Corn Production
Grain Market News
U.S. Drought Monitor
Class Change
High Temperatures
Soil Temperatures
U.S. Radar
7-Day Precipitation Forecast
Low Temperature Forecast
May Corn Chart
Corn prices shot to the upside today, today’s high at 6.68 matches the high from about 2 weeks ago.
Overall today’s move makes the chart look good and was enough to turn the technical up.
Prices are now approaching overhead resistance at the 6.68-6.70 range.
May Soybean Chart
Soybeans prices were disappointing today with an outside day down.
We did hold chart support and we did close near the upper end of the range.
Bottom line is soybean prices have been chopping back and forth over the last couple of weeks leaving the technical chopping.
May KC Wheat Chart
Wheat prices looked good today after testing chart support.
Wheat prices exploded to the upside and closed near the daily high which makes the chart look good and the technical trying to hook upward as well.
Unless we get bearish news it does look like this market may be interested in testing the area of 9.02-9.09.
Recommendations
\Questions or Commentstions or CoWheat prices had a massive move today challenging contract lows of $7.36 overnight last night turning around and closing at $7.85 49 cents off the daily low. This was a massive reversal to the upside, very impressive not only from the fact we closed 44-45 cents higher, but certainly shows up as a significant move on the chart turning the technical indicators up as well. Certainly the wheat market looks like it confirmation of bottoming action today.
Today’s Prices
Grain markets finished mostly lower today as the trade prepares for what they believe will be a bearish crop report tomorrow.
Grain Market News
7-Day Observed Precipitation
The far southwestern plains in Kansas, Texas, and Oklahoma are missing out on rain but they had rain 2 weeks agio.
The blue areas may be of concern.
High Temperatures
Yesterday’s high temperatures were almost perfect.
Mid 70s to mid-80s for the entire U.S. corn and bean belt
U.S. Radar
The radar shows scattered showers which have been common over the last week or so.
7-Day Precipitation Forecast
The forecast shows significant rains in the northern plains with 1-3 inches.
Heavy rains in Texas, pushing northward into southern Oklahoma area with 2-4 or 3-5 inches of rain or more.
Outlook
The 6-10 days are mostly dry for the northern 3/4 of the belt which continues into the northern 2/3 of the belt in the 8-10 day.
Temperatures generally cooler to the southeast and warmer to northwest.
The central belt like Iowa could be somewhat close to normal.
Grain Market News
Corn: Weekly Export Sales
Soybeans: Weekly Export Sales
Wheat: Weekly Export Sales
Ending Stocks
May Corn Chart
Corn prices have been very choppy.
We rallied through March into April and then we fell sharply at the end of April and beginning of May.
The bottom line is prices are now consolidating near the low end of the range.
May Soybean Chart
Soybeans rallied and fell just like corn up and down.
Soybeans are now also consolidating near the lower end of the range with some of the lowest prices we’ve seen over the last 10 months.
May KC Wheat Chart
Wheat prices are up, they are up about a $1.
Prices are getting close to initial overhead resistance with technical indicators getting into the overbought range.
With the crop report out tomorrow, chart and technical will not dominate tomorrow it will be the crop report that determines wheat prices.
Grain markets finished higher today, rumors that Russia may not allow the continuation of the shipping corridor supported the bounce.
Weekly Price Summary
Grain Market News
Corn Production
Grain Market News
U.S. Drought Monitor
Class Change
High Temperatures
Soil Temperatures
U.S. Radar
7-Day Precipitation Forecast
Low Temperature Forecast
May Corn Chart
Corn prices shot to the upside today, today’s high at 6.68 matches the high from about 2 weeks ago.
Overall today’s move makes the chart look good and was enough to turn the technical up.
Prices are now approaching overhead resistance at the 6.68-6.70 range.
May Soybean Chart
Soybeans prices were disappointing today with an outside day down.
We did hold chart support and we did close near the upper end of the range.
Bottom line is soybean prices have been chopping back and forth over the last couple of weeks leaving the technical chopping.
May KC Wheat Chart
Wheat prices looked good today after testing chart support.
Wheat prices exploded to the upside and closed near the daily high which makes the chart look good and the technical trying to hook upward as well.
Unless we get bearish news it does look like this market may be interested in testing the area of 9.02-9.09.
Recommendations
Questions or Comments
Today’s Prices
Grain markets finished higher today, rumors that Russia may not allow the continuation of the shipping corridor supported the bounce.
Weekly Price Summary
Grain Market News
Corn Production
Grain Market News
U.S. Drought Monitor
Class Change
High Temperatures
Soil Temperatures
U.S. Radar
7-Day Precipitation Forecast
Low Temperature Forecast
May Corn Chart
Corn prices shot to the upside today, today’s high at 6.68 matches the high from about 2 weeks ago.
Overall today’s move makes the chart look good and was enough to turn the technical up.
Prices are now approaching overhead resistance at the 6.68-6.70 range.
May Soybean Chart
Soybeans prices were disappointing today with an outside day down.
We did hold chart support and we did close near the upper end of the range.
Bottom line is soybean prices have been chopping back and forth over the last couple of weeks leaving the technical chopping.
May KC Wheat Chart
Wheat prices looked good today after testing chart support.
Wheat prices exploded to the upside and closed near the daily high which makes the chart look good and the technical trying to hook upward as well.
Unless we get bearish news it does look like this market may be interested in testing the area of 9.02-9.09.
Recommendations
\Questions or Commentstions or CoWheat prices had a massive move today challenging contract lows of $7.36 overnight last night turning around and closing at $7.85 49 cents off the daily low. This was a massive reversal to the upside, very impressive not only from the fact we closed 44-45 cents higher, but certainly shows up as a significant move on the chart turning the technical indicators up as well. Certainly the wheat market looks like it confirmation of bottoming action today.
Today’s Prices
Grain markets finished mixed today as prices are chopping back and forth ahead of the crop report coming out this Friday.
Grain Market News
7-Day Observed Precipitation
7-Day Precipitation Forecast
Outlook
Grain Market News
Wheat Production
Ending Stocks
South American 2023 Production
World Ending Stocks
Weekly Ethanol Production
Ethanol production declined slightly from last week down to 965 thousand barrels per day.
Year to date we are down 2.6% whereas USDA is estimating we will be down 1.5%.
Weekly Stocks of Fuel Ethanol
Stocks declined just slightly from last week down to 23.293 million barrels.
That is 3.5% below last year’s level and overall, we think the ethanol industry is doing good.
May Corn Chart
Corn prices pushed lower overnight last night but rallied today closing strong.
The chart has been very choppy.
Overall, it still looks like we may have set a significant Spring low a week ago at 5.69.
Today’s close at 5.94 is 25 cents above the low indicating the possibility of a low.
May Soybean Chart
Soybeans down in late April then up and then down and so on, so very choppy in a sideways range.
The lower trade the last two days is disappointing and has turned the technical lower as well.
May KC Wheat Chart
Wheat prices made a new high early today at 8.63.
Technical indicators are now in the overbought range.
Grain markets finished higher today, rumors that Russia may not allow the continuation of the shipping corridor supported the bounce.
Weekly Price Summary
Grain Market News
Corn Production
Grain Market News
U.S. Drought Monitor
Class Change
High Temperatures
Soil Temperatures
U.S. Radar
7-Day Precipitation Forecast
Low Temperature Forecast
May Corn Chart
Corn prices shot to the upside today, today’s high at 6.68 matches the high from about 2 weeks ago.
Overall today’s move makes the chart look good and was enough to turn the technical up.
Prices are now approaching overhead resistance at the 6.68-6.70 range.
May Soybean Chart
Soybeans prices were disappointing today with an outside day down.
We did hold chart support and we did close near the upper end of the range.
Bottom line is soybean prices have been chopping back and forth over the last couple of weeks leaving the technical chopping.
May KC Wheat Chart
Wheat prices looked good today after testing chart support.
Wheat prices exploded to the upside and closed near the daily high which makes the chart look good and the technical trying to hook upward as well.
Unless we get bearish news it does look like this market may be interested in testing the area of 9.02-9.09.
Recommendations
Questions or Comments
Today’s Prices
Grain markets finished higher today, rumors that Russia may not allow the continuation of the shipping corridor supported the bounce.
Weekly Price Summary
Grain Market News
Corn Production
Grain Market News
U.S. Drought Monitor
Class Change
High Temperatures
Soil Temperatures
U.S. Radar
7-Day Precipitation Forecast
Low Temperature Forecast
May Corn Chart
Corn prices shot to the upside today, today’s high at 6.68 matches the high from about 2 weeks ago.
Overall today’s move makes the chart look good and was enough to turn the technical up.
Prices are now approaching overhead resistance at the 6.68-6.70 range.
May Soybean Chart
Soybeans prices were disappointing today with an outside day down.
We did hold chart support and we did close near the upper end of the range.
Bottom line is soybean prices have been chopping back and forth over the last couple of weeks leaving the technical chopping.
May KC Wheat Chart
Wheat prices looked good today after testing chart support.
Wheat prices exploded to the upside and closed near the daily high which makes the chart look good and the technical trying to hook upward as well.
Unless we get bearish news it does look like this market may be interested in testing the area of 9.02-9.09.
Recommendations
Questions or Commentstions or CoWheat prices had a massive move today challenging contract lows of $7.36 overnight last night turning around and closing at $7.85 49 cents off the daily low. This was a massive reversal to the upside, very impressive not only from the fact we closed 44-45 cents higher, but certainly shows up as a significant move on the chart turning the technical indicators up as well. Certainly the wheat market looks like it confirmation of bottoming action today.
Today’s Prices
Corn and soybeans finished lower today, not on a single story but a few slightly negative items pushing them lower.
Grain Market News
Corn Planting Progress
Soybean Planting Progress
Winter Wheat Conditions
Grain Market News
14-Day Observed Precipitation
Over the last 2 weeks we have seen some good rain in the heart of the belt.
Anywhere from .5-2.5 inches has been common through much of Nebraska, Iowa, and almost all of Illinois.
We’ve seen a little bit more rain than desired in Indiana, Ohio, Michigan, and North Dakota.
There is a dry pocket from southwest Minnesota to southeast South Dakota, but they are trying to plant so that is good news.
14-Day Precipitation % of Normal
You can see the dry pocket in southern Minnesota and South Dakota which is actually okay because they are planting.
We also see the dry spot in Kansas and Missouri.
The heavy rains in the heart of t the belt have allowed us to pick up some moisture and get precipitation closer to normal in portions of Nebraska, Iowa, and Illinois.
U.S. Radar
The radar shows rain in southern Nebraska and north central Kansas.
Those areas, as long as it’s not severe, will welcome the rain.
We see some scattered showers that could delay things further north.
7-Day Precipitation Forecast
The forecast does show some rain in the far northern plains which could create some problems.
Heavy rains down in Texas moving into Oklahoma, most of that rain would be welcomed.
There is less precipitation forecast for Nebraska, Iowa, and Illinois.
Outlook
This shows warming conditions in the northwestern belt which would be good news to get planting going in North Dakota and adjacent areas.
We will be monitoring to see if dryness becomes a problem in portions of Nebraska, Iowa, Kansas, and Missouri as we do have a dryer forecast long term.
May Corn Chart
Corn prices were disappointing, a sharp down day and closing down sharply as well.
The chart did look good up until yesterday, but today’s down move does need some watching as the chart could turn lower.
This hooked the technical indicator down as well.
May Soybean Chart
Soybean prices also turned lower today; they looked good up through yesterday, but today’s poor performance does turn the short term back down.
One day does not make a trend but it will be important for the market to stabilize and try to bounce in the next few days.
May KC Wheat Chart
Wheat prices actually had a very good day in KC.
Starting out the day lower and turning around and closing near the day’s high, a new high close in nearly a month.
The KC wheat chart still looks good and the technical looks good.
Grain markets finished higher today, rumors that Russia may not allow the continuation of the shipping corridor supported the bounce.
Weekly Price Summary
Grain Market News
Corn Production
Grain Market News
U.S. Drought Monitor
Class Change
High Temperatures
Soil Temperatures
U.S. Radar
7-Day Precipitation Forecast
Low Temperature Forecast
May Corn Chart
Corn prices shot to the upside today, today’s high at 6.68 matches the high from about 2 weeks ago.
Overall today’s move makes the chart look good and was enough to turn the technical up.
Prices are now approaching overhead resistance at the 6.68-6.70 range.
May Soybean Chart
Soybeans prices were disappointing today with an outside day down.
We did hold chart support and we did close near the upper end of the range.
Bottom line is soybean prices have been chopping back and forth over the last couple of weeks leaving the technical chopping.
May KC Wheat Chart
Wheat prices looked good today after testing chart support.
Wheat prices exploded to the upside and closed near the daily high which makes the chart look good and the technical trying to hook upward as well.
Unless we get bearish news it does look like this market may be interested in testing the area of 9.02-9.09.
Recommendations
Questions or Comments
Today’s Prices
Grain markets finished higher today, rumors that Russia may not allow the continuation of the shipping corridor supported the bounce.
Weekly Price Summary
Grain Market News
Corn Production
Grain Market News
U.S. Drought Monitor
Class Change
High Temperatures
Soil Temperatures
U.S. Radar
7-Day Precipitation Forecast
Low Temperature Forecast
May Corn Chart
Corn prices shot to the upside today, today’s high at 6.68 matches the high from about 2 weeks ago.
Overall today’s move makes the chart look good and was enough to turn the technical up.
Prices are now approaching overhead resistance at the 6.68-6.70 range.
May Soybean Chart
Soybeans prices were disappointing today with an outside day down.
We did hold chart support and we did close near the upper end of the range.
Bottom line is soybean prices have been chopping back and forth over the last couple of weeks leaving the technical chopping.
May KC Wheat Chart
Wheat prices looked good today after testing chart support.
Wheat prices exploded to the upside and closed near the daily high which makes the chart look good and the technical trying to hook upward as well.
Unless we get bearish news it does look like this market may be interested in testing the area of 9.02-9.09.
Recommendations
Questions or Commentstions or CoWheat prices had a massive move today challenging contract lows of $7.36 overnight last night turning around and closing at $7.85 49 cents off the daily low. This was a massive reversal to the upside, very impressive not only from the fact we closed 44-45 cents higher, but certainly shows up as a significant move on the chart turning the technical indicators up as well. Certainly the wheat market looks like it confirmation of bottoming action today.
Today’s Prices
Grain markets finished mixed today as the news items were also very mixed, not providing any clear direction.
Grain Market News
7-Day Observed Precipitation
Delays can be expected in North Dakota, South Dakota, Minnesota, and the far eastern belt.
Dry pockets in southern southwestern Minnesota, eastern South Dakota, far northwest Iowa where they missed out on the rain.
Central and southern Kansas, Oklahoma, southeast Colorado, and the central delta missed out as well.
We seen good amounts of rain across much of Nebraska, Iowa, and Illinois.
U.S. Radar
As of midday today there was some scattered in North Dakota that was unwanted and then some rain in Wisconsin, northern Illinois into Michigan.
High Temperatures
We seen temperatures in the 90s over the weekend in the central plains into northwestern Missouri while 50s were seen in North Dakota and adjacent areas of Minnesota and South Dakota.
7-Day Precipitation Forecast
The forecast shows unwanted precipitation in the far northern plains and the far eastern belt.
But there will be more welcome rain from the central plains into the western belt and heavy rain in Texas and Oklahoma.
Some areas that are still trying to plant could get additional rain but some areas that need rain could get additional showers.
Temperature Outlook
Grain Market News
Corn: Weekly Export Inspections
Corn this week was back down to 37.9 and back below the level needed.
One week doesn’t make a trend but we need to see them consistently running around 54 million bushels per week.
Soybeans: Weekly Export Inspections
Soybeans at 14.5 million bushels, below the level needed.
We would like to see some numbers closer to 20 million bushels in May and June.
Wheat: Weekly Export Inspections
Wheat inspections were 7.6 million bushels, well below the level needed.
The level needed does not include export donations, giveaways, and food programs which normally accounts for 25-45 million bushels.
May Corn Chart
Corn looks good, still showing signs of bouncing off the lows posted last week.
Old crop July corn has now bounced 31 cents off the low posted last week.
The technical looks good as well.
This market may have another 15 cents to the upside from a chart and technical perspective.
May Soybean Chart
Soybeans looking good with a new high for the move, but we did turn around and close lower.
The next level of overhead resistance would be a triple bottom around 14.68 level.
May KC Wheat Chart
Wheat had a high today of 8.59, $1.23 above the lows posted last week.
This chart looks good from a chart perspective with 8.45-8.46 overhead resistance.
Grain markets finished higher today, rumors that Russia may not allow the continuation of the shipping corridor supported the bounce.
Weekly Price Summary
Grain Market News
Corn Production
Grain Market News
U.S. Drought Monitor
Class Change
High Temperatures
Soil Temperatures
U.S. Radar
7-Day Precipitation Forecast
Low Temperature Forecast
May Corn Chart
Corn prices shot to the upside today, today’s high at 6.68 matches the high from about 2 weeks ago.
Overall today’s move makes the chart look good and was enough to turn the technical up.
Prices are now approaching overhead resistance at the 6.68-6.70 range.
May Soybean Chart
Soybeans prices were disappointing today with an outside day down.
We did hold chart support and we did close near the upper end of the range.
Bottom line is soybean prices have been chopping back and forth over the last couple of weeks leaving the technical chopping.
May KC Wheat Chart
Wheat prices looked good today after testing chart support.
Wheat prices exploded to the upside and closed near the daily high which makes the chart look good and the technical trying to hook upward as well.
Unless we get bearish news it does look like this market may be interested in testing the area of 9.02-9.09.
Recommendations
Questions or Comments
Today’s Prices
Grain markets finished higher today, rumors that Russia may not allow the continuation of the shipping corridor supported the bounce.
Weekly Price Summary
Grain Market News
Corn Production
Grain Market News
U.S. Drought Monitor
Class Change
High Temperatures
Soil Temperatures
U.S. Radar
7-Day Precipitation Forecast
Low Temperature Forecast
May Corn Chart
Corn prices shot to the upside today, today’s high at 6.68 matches the high from about 2 weeks ago.
Overall today’s move makes the chart look good and was enough to turn the technical up.
Prices are now approaching overhead resistance at the 6.68-6.70 range.
May Soybean Chart
Soybeans prices were disappointing today with an outside day down.
We did hold chart support and we did close near the upper end of the range.
Bottom line is soybean prices have been chopping back and forth over the last couple of weeks leaving the technical chopping.
May KC Wheat Chart
Wheat prices looked good today after testing chart support.
Wheat prices exploded to the upside and closed near the daily high which makes the chart look good and the technical trying to hook upward as well.
Unless we get bearish news it does look like this market may be interested in testing the area of 9.02-9.09.
Recommendations
Questions or Commentstions or CoWheat prices had a massive move today challenging contract lows of $7.36 overnight last night turning around and closing at $7.85 49 cents off the daily low. This was a massive reversal to the upside, very impressive not only from the fact we closed 44-45 cents higher, but certainly shows up as a significant move on the chart turning the technical indicators up as well. Certainly the wheat market looks like it confirmation of bottoming action today.
Today’s Prices
Grain markets finished higher today, rumors that Russia may not allow the continuation of the shipping corridor supported the bounce.
Weekly Price Summary
Grain Market News
Corn Production
Grain Market News
U.S. Drought Monitor
Class Change
High Temperatures
Soil Temperatures
U.S. Radar
7-Day Precipitation Forecast
Low Temperature Forecast
May Corn Chart
Corn prices shot to the upside today, today’s high at 6.68 matches the high from about 2 weeks ago.
Overall today’s move makes the chart look good and was enough to turn the technical up.
Prices are now approaching overhead resistance at the 6.68-6.70 range.
May Soybean Chart
Soybeans prices were disappointing today with an outside day down.
We did hold chart support and we did close near the upper end of the range.
Bottom line is soybean prices have been chopping back and forth over the last couple of weeks leaving the technical chopping.
May KC Wheat Chart
Wheat prices looked good today after testing chart support.
Wheat prices exploded to the upside and closed near the daily high which makes the chart look good and the technical trying to hook upward as well.
Unless we get bearish news it does look like this market may be interested in testing the area of 9.02-9.09.
Recommendations
Questions or Comments
Today’s Prices
Grain markets finished higher today, rumors that Russia may not allow the continuation of the shipping corridor supported the bounce.
Weekly Price Summary
Grain Market News
Corn Production
Grain Market News
U.S. Drought Monitor
Class Change
High Temperatures
Soil Temperatures
U.S. Radar
7-Day Precipitation Forecast
Low Temperature Forecast
May Corn Chart
Corn prices shot to the upside today, today’s high at 6.68 matches the high from about 2 weeks ago.
Overall today’s move makes the chart look good and was enough to turn the technical up.
Prices are now approaching overhead resistance at the 6.68-6.70 range.
May Soybean Chart
Soybeans prices were disappointing today with an outside day down.
We did hold chart support and we did close near the upper end of the range.
Bottom line is soybean prices have been chopping back and forth over the last couple of weeks leaving the technical chopping.
May KC Wheat Chart
Wheat prices looked good today after testing chart support.
Wheat prices exploded to the upside and closed near the daily high which makes the chart look good and the technical trying to hook upward as well.
Unless we get bearish news it does look like this market may be interested in testing the area of 9.02-9.09.
Recommendations
Questions or Comments
Today’s Prices
Grain markets finished higher today, rumors that Russia may not allow the continuation of the shipping corridor supported the bounce.
Weekly Price Summary
Grain Market News
Corn Production
Grain Market News
U.S. Drought Monitor
Class Change
High Temperatures
Soil Temperatures
U.S. Radar
7-Day Precipitation Forecast
Low Temperature Forecast
May Corn Chart
Corn prices shot to the upside today, today’s high at 6.68 matches the high from about 2 weeks ago.
Overall today’s move makes the chart look good and was enough to turn the technical up.
Prices are now approaching overhead resistance at the 6.68-6.70 range.
May Soybean Chart
Soybeans prices were disappointing today with an outside day down.
We did hold chart support and we did close near the upper end of the range.
Bottom line is soybean prices have been chopping back and forth over the last couple of weeks leaving the technical chopping.
May KC Wheat Chart
Wheat prices looked good today after testing chart support.
Wheat prices exploded to the upside and closed near the daily high which makes the chart look good and the technical trying to hook upward as well.
Unless we get bearish news it does look like this market may be interested in testing the area of 9.02-9.09.
RecommendationsQuestions or Commentstions or Co
Today’s Prices
Grain markets finished higher today, rumors that Russia may not allow the continuation of the shipping corridor supported the bounce.
Weekly Price Summary
Grain Market News
Corn Production
Grain Market News
U.S. Drought Monitor
Class Change
High Temperatures
Soil Temperatures
U.S. Radar
7-Day Precipitation Forecast
Low Temperature Forecast
May Corn Chart
Corn prices shot to the upside today, today’s high at 6.68 matches the high from about 2 weeks ago.
Overall today’s move makes the chart look good and was enough to turn the technical up.
Prices are now approaching overhead resistance at the 6.68-6.70 range.
May Soybean Chart
Soybeans prices were disappointing today with an outside day down.
We did hold chart support and we did close near the upper end of the range.
Bottom line is soybean prices have been chopping back and forth over the last couple of weeks leaving the technical chopping.
May KC Wheat Chart
Wheat prices looked good today after testing chart support.
Wheat prices exploded to the upside and closed near the daily high which makes the chart look good and the technical trying to hook upward as well.
Unless we get bearish news it does look like this market may be interested in testing the area of 9.02-9.09.
Recommendations
Questions or Comments
Today’s Prices
Grain markets finished higher today, rumors that Russia may not allow the continuation of the shipping corridor supported the bounce.
Weekly Price Summary
Grain Market News
Corn Production
Grain Market News
U.S. Drought Monitor
Class Change
High Temperatures
Soil Temperatures
U.S. Radar
7-Day Precipitation Forecast
Low Temperature Forecast
May Corn Chart
Corn prices shot to the upside today, today’s high at 6.68 matches the high from about 2 weeks ago.
Overall today’s move makes the chart look good and was enough to turn the technical up.
Prices are now approaching overhead resistance at the 6.68-6.70 range.
May Soybean Chart
Soybeans prices were disappointing today with an outside day down.
We did hold chart support and we did close near the upper end of the range.
Bottom line is soybean prices have been chopping back and forth over the last couple of weeks leaving the technical chopping.
May KC Wheat Chart
Wheat prices looked good today after testing chart support.
Wheat prices exploded to the upside and closed near the daily high which makes the chart look good and the technical trying to hook upward as well.
Unless we get bearish news it does look like this market may be interested in testing the area of 9.02-9.09.
Recommendations
Questions or Commentstions or CoWheat prices had a massive move today challenging contract lows of $7.36 overnight last night turning around and closing at $7.85 49 cents off the daily low. This was a massive reversal to the upside, very impressive not only from the fact we closed 44-45 cents higher, but certainly shows up as a significant move on the chart turning the technical indicators up as well. Certainly the wheat market looks like it confirmation of bottoming action today.
Today’s Prices
Grain markets finished higher today as there has been no decisions regarding the Ukrainian shipping corridor.
Weekly Price Summary
Grain Market News
Ukraine Wheat Production
Ukraine Grain Shipping Corridor
Map
Grain Market News
7-Day Observed Precipitation
24-Hour Observed Precipitation
U.S. Radar
The radar this afternoon does show some light precipitation in western Iowa, eastern Nebraska, and northern Missouri.
7-Day Precipitation Forecast
The forecast does show 1-2 inches of rain from Kansas, Nebraska, into South Dakota and North Dakota.
Half inch to an inch and a half across much of the eastern belt with slightly less rain for southern Minnesota and Iowa.
The eastern and far northern Plains are not welcome in this precipitation.
Outlook
The 6-10 days have above normal temperatures which are favorable.
Precipitation is above normal in the central and western belt into the plains.
The 8-14 does show a dryer pattern in the North Dakota area with additional rains in the southern belt.
May Corn Chart
Corn prices look very good from a short-term perspective.
Today is clearly a breakout to the upside and has the chart and technical looking good.
This area between 5.97-6.15 is a target area for corn from a char perspective in the near term.
May Soybean Chart
Soybean prices had a good day, not a clean breakout though.
We did have a new high close for the movie closing at 14.36.
The technical indicators look good as well.
If we can close above the 14.40 level, which we are close to, the next objective would be around 14.68.
May KC Wheat Chart
Wheat has exploded to the upside, trading a $1 higher in just 3 sessions.
This has improved the technical indicators as well.
The 20- and 40-day moving averages around 8.20 should provide initial support with overhead around 8.75.