Today’s Prices

Grain markets finished higher today with outside markets providing support as the debt ceiling was approved by the house and the weather looks threatening for the belt.
Grain Market News

April 2023 Rainfall

April was extremely dry in much of the corn and bean belt.
Drought conditions were extreme in portions of Nebraska and Kansas.
We also saw dryness developing in Iowa, Illinois, Indiana, and Missouri.
May 2023 Rainfall

In May we have seen significant pattern changes where moisture was much more plentiful in the western plains while dryness impacted the heart of the belt.
Keep in mind anything red or darker red are areas that saw less than 25% of normal through the month of May.
April-May 2023 Rainfall

Combine April and May together you can see the bulk of the belt has been much below normal for the last 60 days.
Anything in the darker tan is less than 50% of normal.
High Temperatures

In addition to the dryness temperatures continue to be around 90 degrees.
Virtually the entire belt was in the upper 80s to low 90s yesterday.
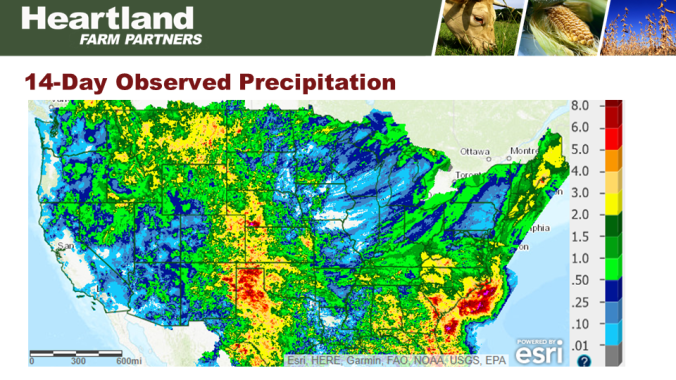
7-Day Observed Precipitation

Much of the eastern belt down into the delta has received very little or no precipitation over the last week.
We did see some scattered rains in the western belt over the last week.
U.S. Radar

We are getting some scattered showers now, but humidity levels have increased with dew points into the 60s.
None of this is organized so if you are underneath one of those showers, you are very fortunate.
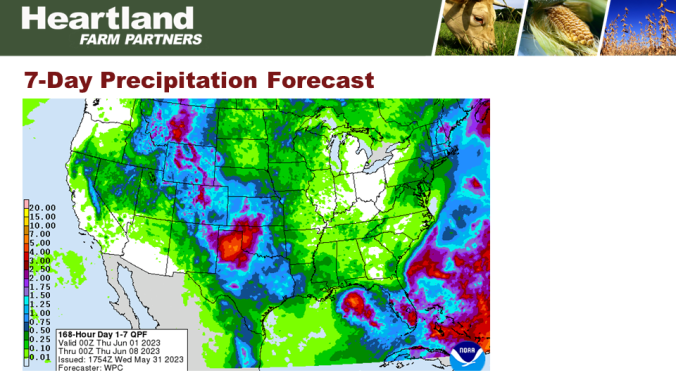
7-Day Precipitation Forecast

Looking ahead the forecast shows the eastern belt continuing to have little to no rain also down into the delta.
The western belt could see some better rains but below normal.
The best rains out in the southern and southwestern plains and up into Montana.
Outlook

The 6–10-day temperatures continue to be above normal temperatures for most of the belt and below normal precipitation.
The cooler temperatures and better rainfall look to be further to the south and west.
There could be some improvement in the 8–14-day forecast.
Soil Moisture

If the forecast is correct, we would see further soil moisture loss and moisture improvement out in the plains into the mountain state.
Official 30-Day Forecast

The forecast for the month of June that came out from the NWS shows above normal temperatures and below normal precipitation for most of the belt.
That’s a very similar pattern to what we have seen in the last few weeks.
If this is correct, we will certainly start to see crop stress.
Drought Outlook

May Corn Chart

Corn prices have rallied nicely with today’s high at 5.36 which matched the highs from late last week.
This does leave the chart pointed upward with technical indicators pointed up as well.
There is no sign of topping action following today’s rally.
As of today, the weather does still look threatening.
May Soybean Chart

Soybean prices after falling sharply Tuesday and Wednesday have rebounded.
Today’s high at 11.75 is 45 cents above yesterday morning’s low.
On the soybean chart it has not been enough to break through the sharp downtrend line.
Today’s high tested the 10-day moving average and the downtrend line.
If we would like to see this market move high toward overhead resistance at 12.47 would be to break through the 10-day moving average.
May KC Wheat Chart

Wheat prices also rebounded off yesterday morning’s low at 7.63 with today’s high at 8.12.
At this time the chart and technical both look good.
We would not be surprised to see the next move pushing into the middle of our trading range.
Questions or Comments